View methods side by side.
Choose up to four methods. Add them using the search and share the comparison by copying its link.
| Criterion |  Product Strategy Lean Canvas |  Business Strategy Ansoff Matrix | 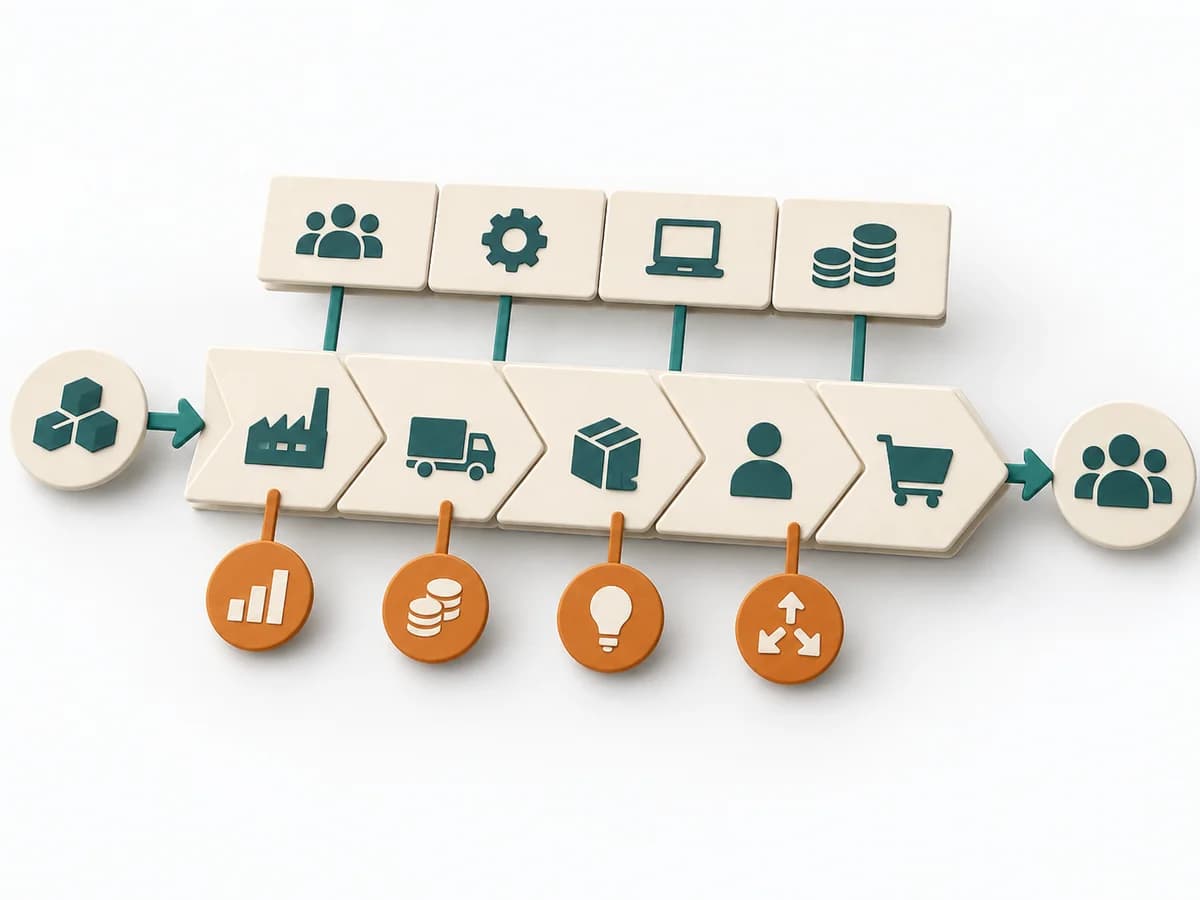 Business Strategy Value Chain Analysis |
|---|---|---|---|
Purposedifferent | When an early product bet still has too many open points, it brings target group, problem, and assumptions into a single view. It condenses the idea so core risks become nameable. | The Ansoff Matrix organizes growth options by market and product relation. It helps weigh expansion, diversification, and adaptation cleanly against each other. | Value Chain Analysis shows where value is created, costs accrue, and differentiation becomes possible along the process. It compares strengths, risks, market logic, and courses of action. The result is captured as a value-chain map and lever list. |
Complexitydifferent | Medium | Low | High |
Timedifferent | 45-90 min | 45-90 min | Half day |
Participantsdifferent | 1-6 | 2-8 | 3-8 |
Formatdifferent | Workshop + async | Workshop + async | Workshop |
Outputdifferent | Lean Canvas, Core Assumptions, Experiment Backlog | Ansoff Matrix, Growth Options, Risk Notes | Value Chain Map, Lever List |
Tagsno overlap | StartupLeanAssumptionsBusiness model | GrowthStrategyMarketPortfolio | StrategyBusiness modelDiagnosisAnalysis |
Often compared together
Methods with strong topical overlap with the current selection, not yet in the comparison.