View methods side by side.
Choose up to four methods. Add them using the search and share the comparison by copying its link.
| Criterion | 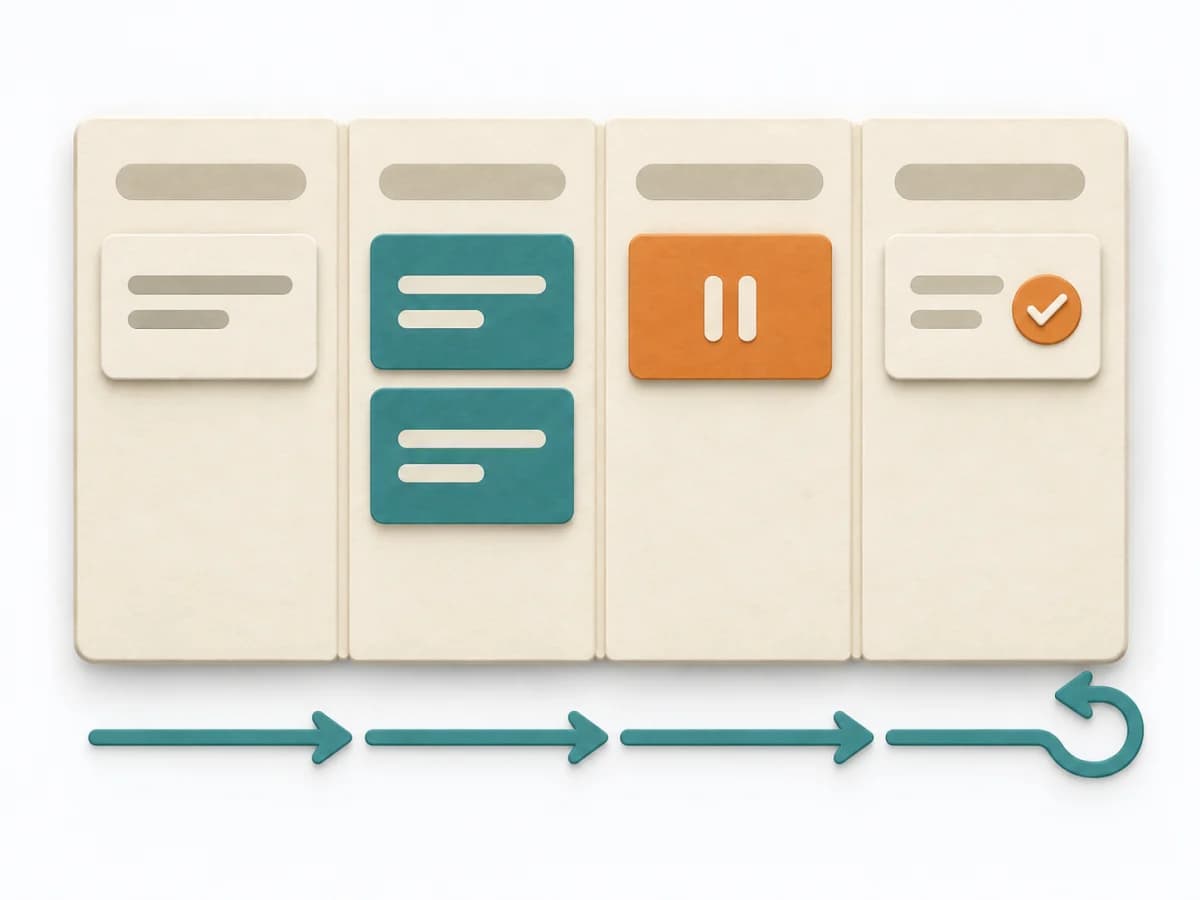 Engineering Kanban |  Facilitation Dot Estimation | 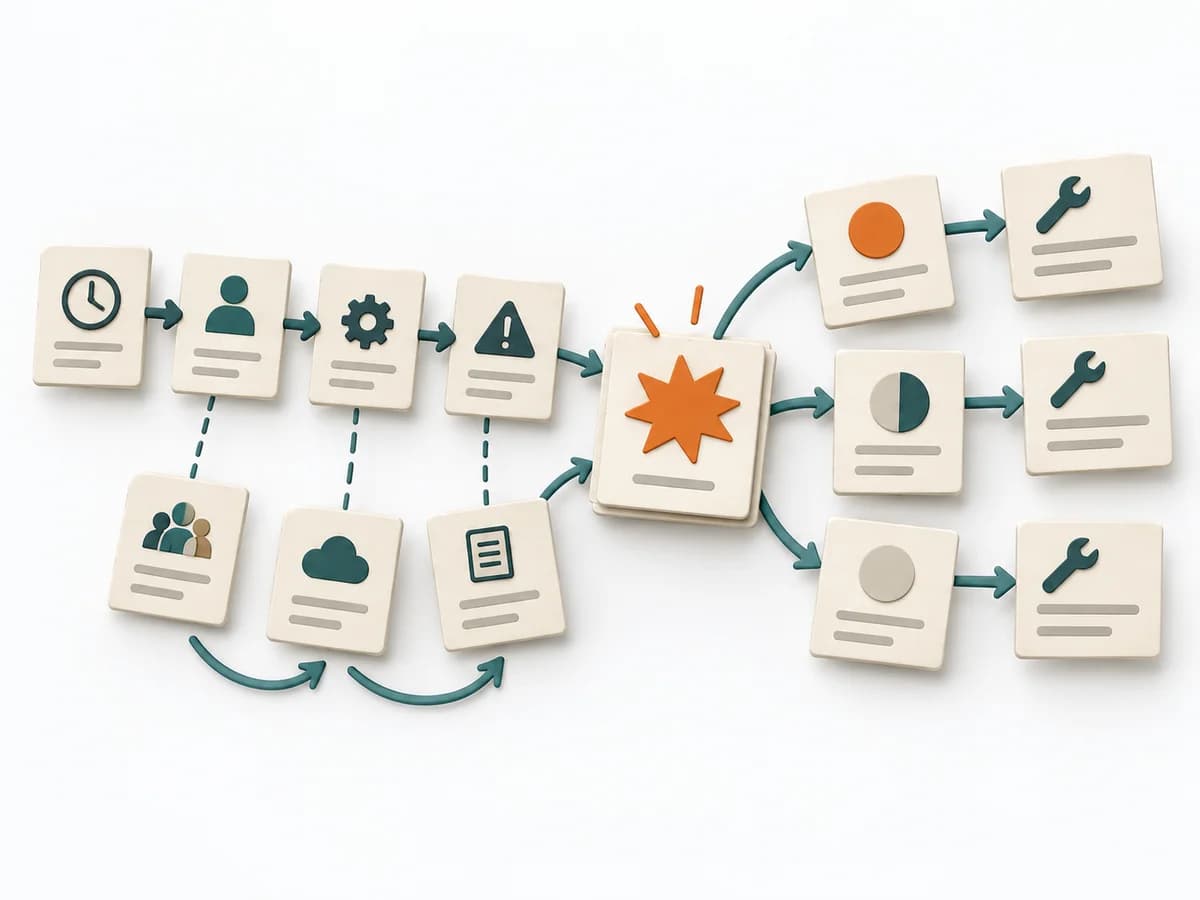 Operations Causal Factor Analysis |
|---|---|---|---|
Purposedifferent | When work sits in too many parallel streams, throughput suffers and no one sees the bottlenecks. Kanban makes the flow of work visible and limits overload so a system becomes calmer and more predictable. | When size or effort can only be estimated roughly, Dot Estimation condenses the group's experience into a quick range. It turns individual contributions into a visible selection. The result is captured as an Effort Heatmap, Risk Signals, and Discussion Targets. | For an event with a complicated course, the method breaks down the contributing factors along the timeline. It shows how conditions, decisions, and reactions together produce a course of events. |
Complexitydifferent | Medium | Low | High |
Timedifferent | Ongoing | 5-20 min | 2-6 h |
Participantsdifferent | 2-12 | 3-20 | 3-10 |
Formatdifferent | Workshop + async | Workshop | Workshop + async |
Outputdifferent | Kanban board, WIP policies, Flow metrics | Effort Heatmap, Risk Signals, Discussion Targets | Event Timeline, Causal Factor Chart, Cause List, Corrective Actions |
Tagsno overlap | FlowVisual managementDelivery | EstimationEffortRisk | CausalityIncidentRoot causeTimeline |
Often compared together
Methods with strong topical overlap with the current selection, not yet in the comparison.