View methods side by side.
Choose up to four methods. Add them using the search and share the comparison by copying its link.
| Criterion | 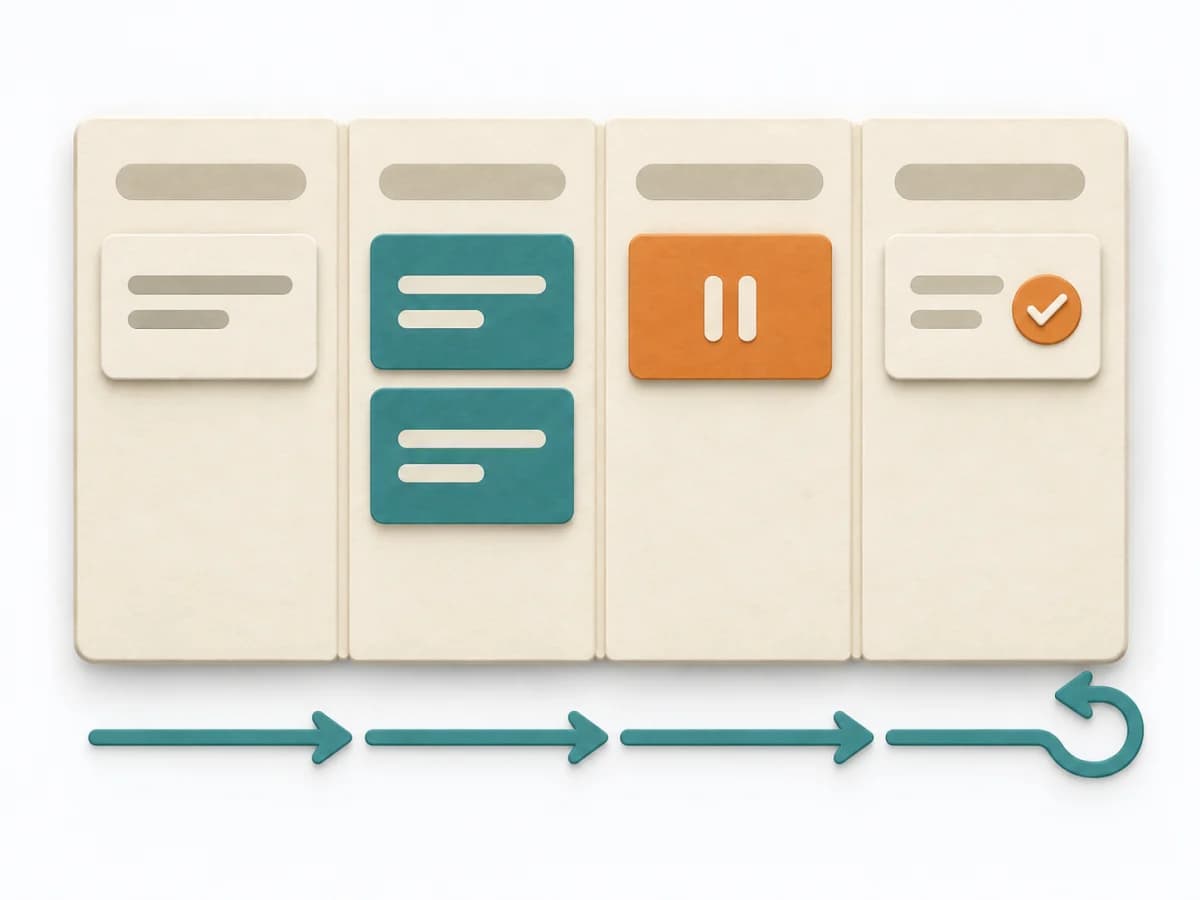 Engineering Kanban | 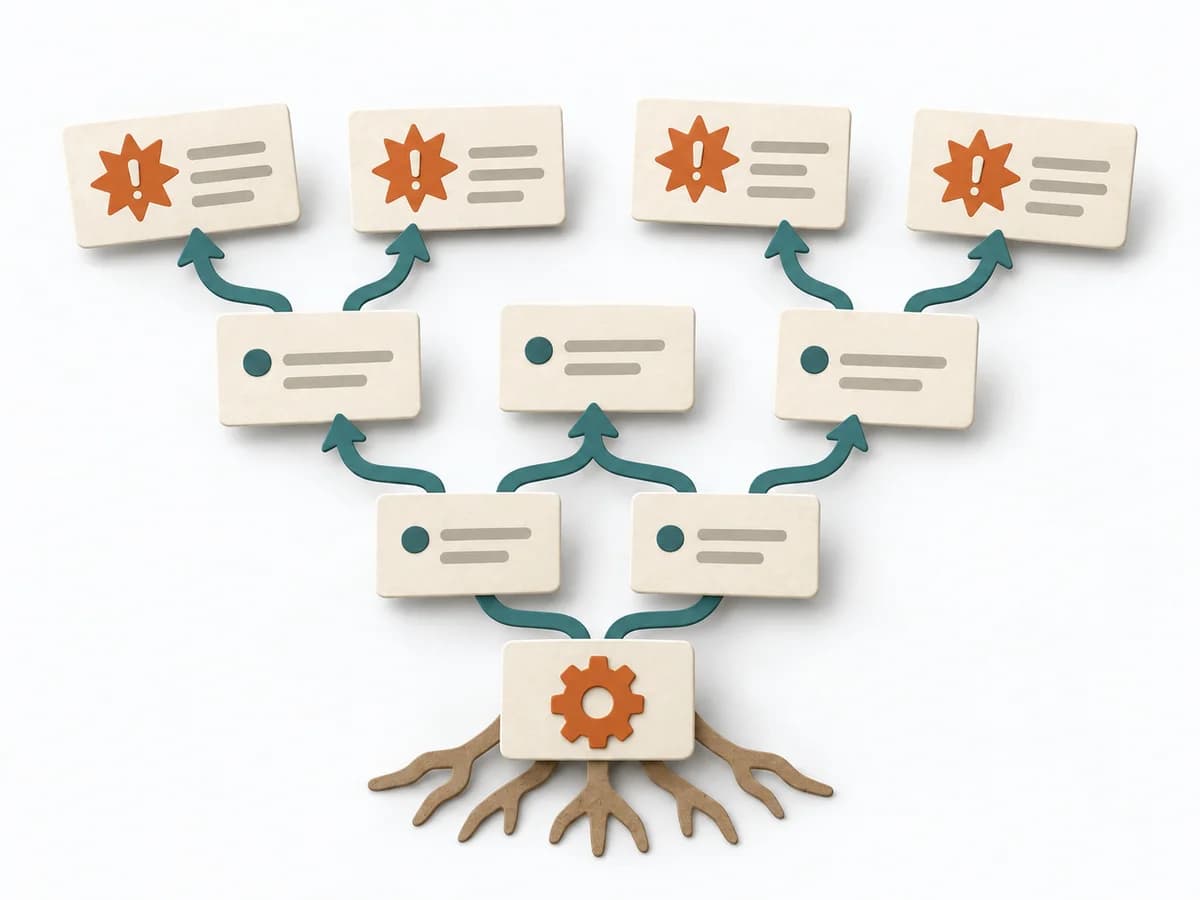 Systems Thinking Current Reality Tree |  Systems Thinking Behavior Over Time Graph |
|---|---|---|---|
Purposedifferent | When work sits in too many parallel streams, throughput suffers and no one sees the bottlenecks. Kanban makes the flow of work visible and limits overload so a system becomes calmer and more predictable. | A Current Reality Tree condenses many symptoms into a few causal chains. The method makes visible which core problems drive several negative effects at once. | A Behavior Over Time Graph shows how a metric or observation develops over time. The method makes trends, breaks, and recurring patterns visible that get lost in snapshots. |
Complexitydifferent | Medium | High | Low |
Timedifferent | Ongoing | 2-6 h | 20-45 min |
Participantsdifferent | 2-12 | 3-8 | 1-10 |
Formatdifferent | Workshop + async | Workshop | Workshop + async |
Outputdifferent | Kanban board, WIP policies, Flow metrics | Current Reality Tree, Core Problems, Intervention Ideas | Behavior Over Time Graph, Trend Hypotheses, Key Events |
Tagsno overlap | FlowVisual managementDelivery | Systems thinkingRoot causeConstraintsCausality | Systems thinkingPatternsDynamics |
Often compared together
Methods with strong topical overlap with the current selection, not yet in the comparison.