View methods side by side.
Choose up to four methods. Add them using the search and share the comparison by copying its link.
| Criterion |  UX Research Customer Journey Mapping | 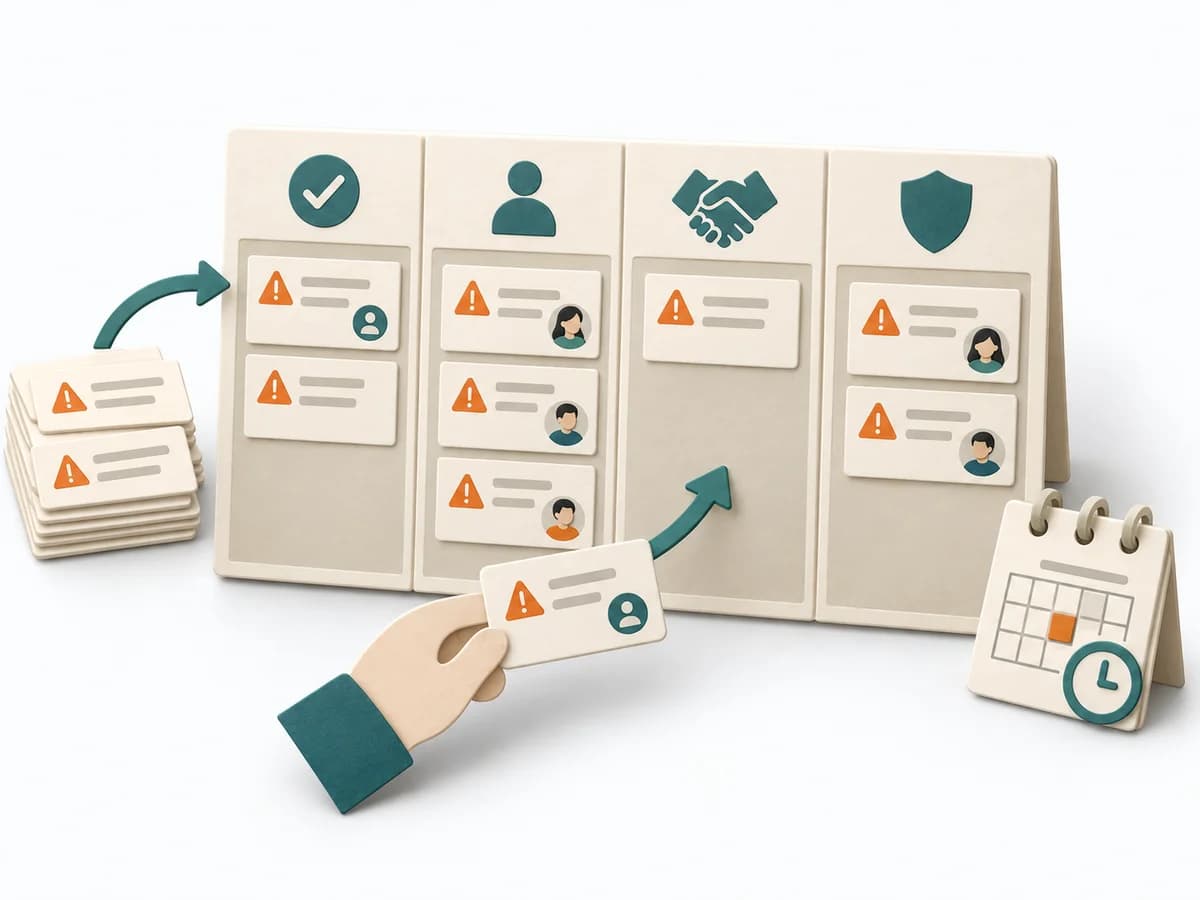 Agile ROAM Board | 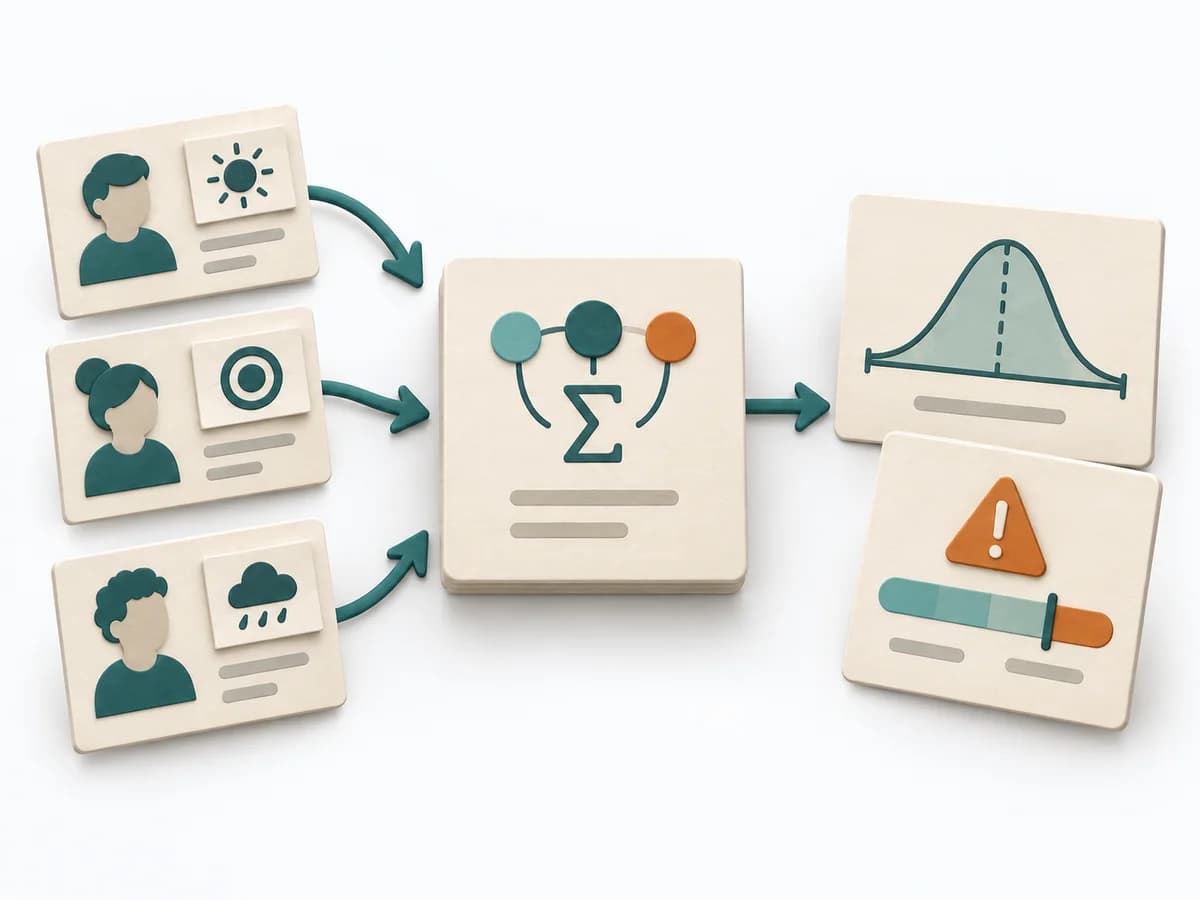 Decision Making PERT Estimation |
|---|---|---|---|
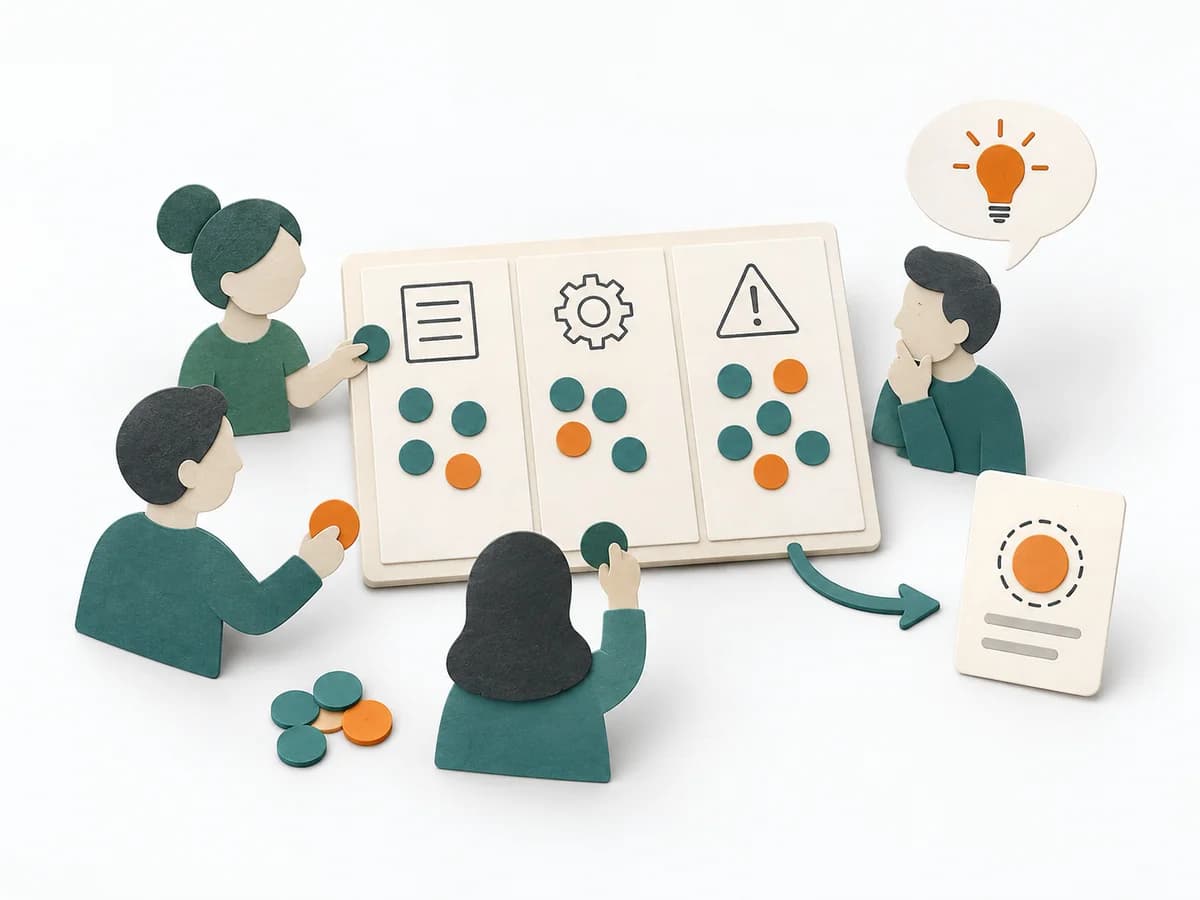
Purposedifferent | When a user journey falls apart across many touchpoints, customer journey mapping makes the experience visible as a coherent arc. Phases, emotions, and breaks become legible enough to prioritize critical moments deliberately. | When work needs to move between different states or columns, it makes that movement and its handoffs legible. It sorts work by value, risk, and delivery ability. The result is captured as a ROAM Board and an Owner List. | On complex initiatives, a plain average tends to understate just how uncertain the outcome really is. It separates options, evaluation criteria, and open risks. The result is captured as a PERT Estimate, Expected Value, and Risk Notes. |
Complexitydifferent | Medium | Low | Medium |
Timedifferent | 2-4 h | 20-40 min initial, dann laufend | 15-45 min |
Participantsdifferent | 4-10 | 3-15 | 1-8 |
Formatdifferent | Workshop | Workshop + async | Workshop + async |
Outputdifferent | Journey Map, Pain-point List, Opportunity Backlog | ROAM Board, Owner List | PERT Estimate, Expected Value, Risk Notes |
Tagsno overlap | JourneyServiceService design | RiskAgileTrackingAlignment | EstimationUncertaintyRisk |
Often compared together
Methods with strong topical overlap with the current selection, not yet in the comparison.