View methods side by side.
Choose up to four methods. Add them using the search and share the comparison by copying its link.
| Criterion |  UX Research Customer Journey Mapping | 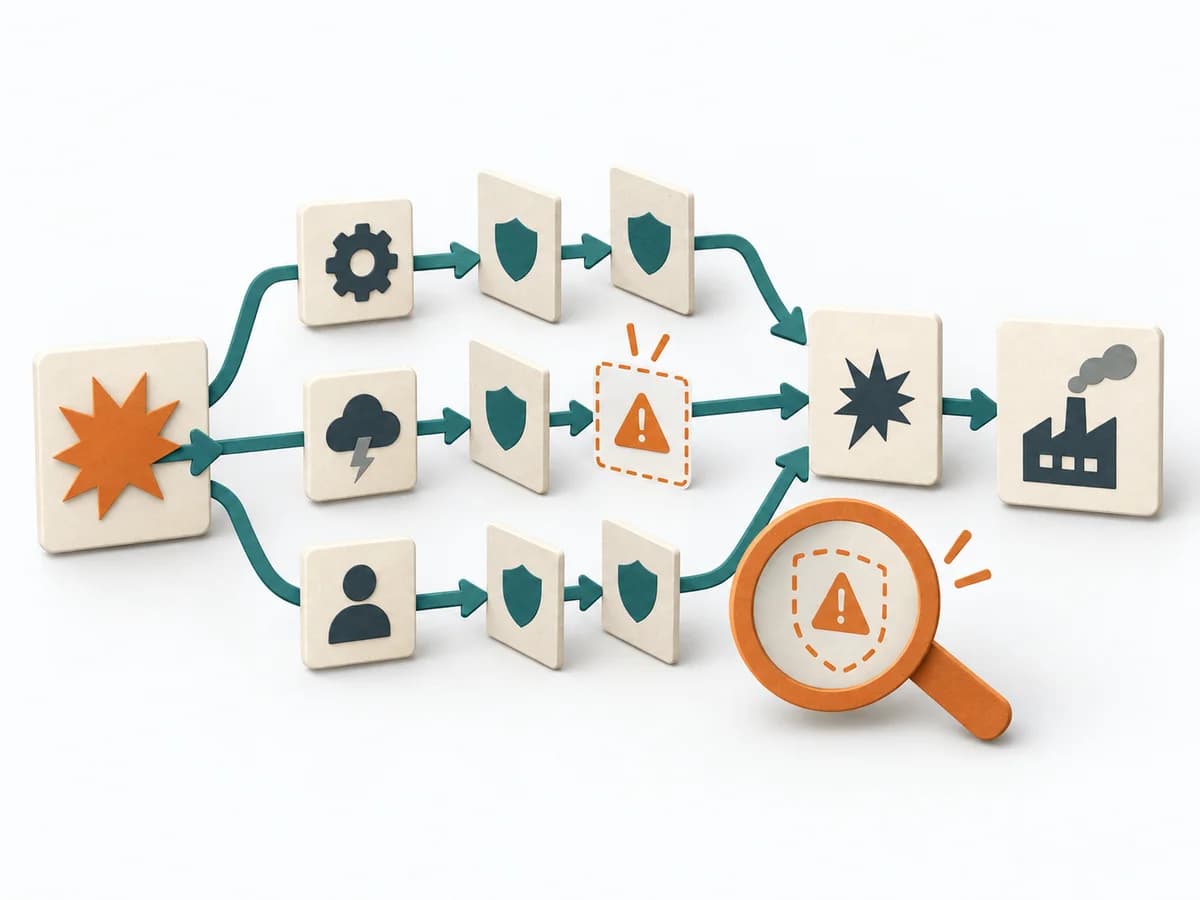 Engineering Failure Scenario Analysis |
|---|---|---|
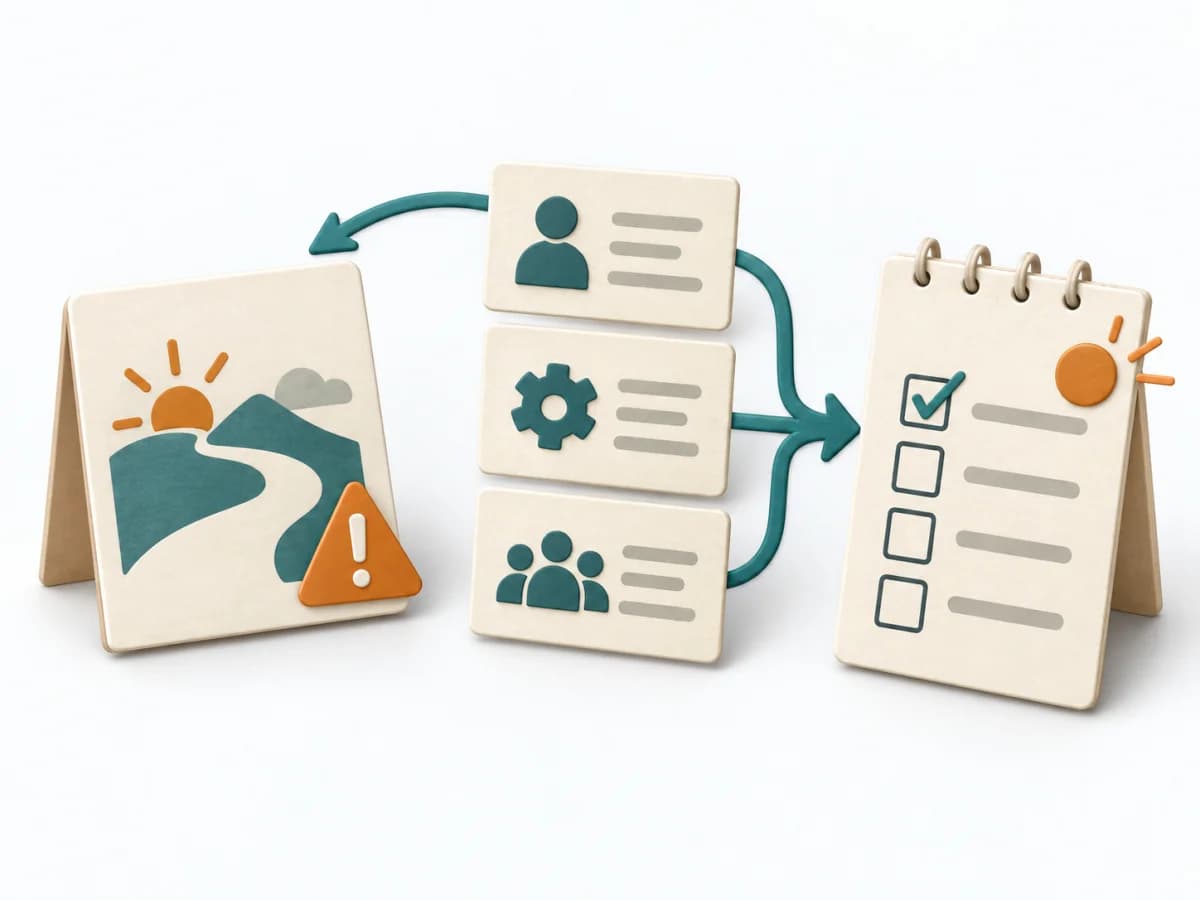
Purposedifferent | When a user journey falls apart across many touchpoints, customer journey mapping makes the experience visible as a coherent arc. Phases, emotions, and breaks become legible enough to prioritize critical moments deliberately. | In critical processes, it is not enough to plan only for the normal case. Failure Scenario Analysis looks at the path into failure and shows which failures, chains, and control gaps cause the most damage. |
Complexitysame | Medium | Medium |
Timedifferent | 2-4 h | 1-3 h |
Participantsdifferent | 4-10 | 3-8 |
Formatsame | Workshop | Workshop |
Outputdifferent | Journey Map, Pain-point List, Opportunity Backlog | Failure Scenarios, Risk Notes, Control Gaps, Test and Response Actions |
Tagsno overlap | JourneyServiceService design | FailureResilienceRisk |
Often compared together
Methods with strong topical overlap with the current selection, not yet in the comparison.