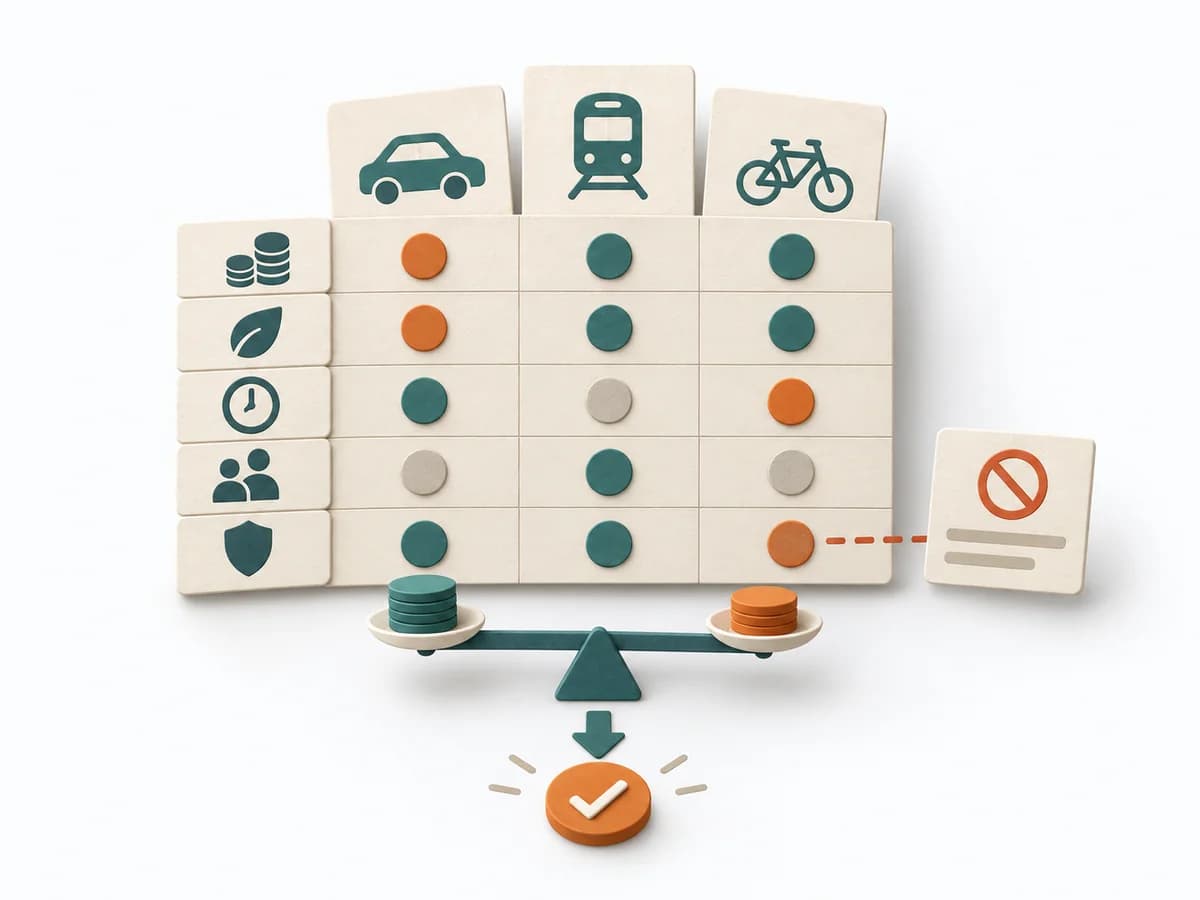
View methods side by side.
Choose up to four methods. Add them using the search and share the comparison by copying its link.
| Criterion |  UX Research Customer Journey Mapping |  Decision Making Decision Matrix |  Product Strategy RICE Scoring |
|---|---|---|---|
Purposedifferent | When a user journey falls apart across many touchpoints, customer journey mapping makes the experience visible as a coherent arc. Phases, emotions, and breaks become legible enough to prioritize critical moments deliberately. | When several options collide with several criteria, comparison quickly becomes subjective. A Decision Matrix makes the trade-off visible and brings weighting, criteria, and options into a shared logic. | When many initiatives compete for the same resources, it brings reach, impact, confidence, and effort into one shared ranking. It makes prioritization economically connectable. |
Complexitysame | Medium | Medium | Medium |
Timedifferent | 2-4 h | 45-90 min | 60-90 min |
Participantsdifferent | 4-10 | 2-8 | 2-10 |
Formatdifferent | Workshop | Workshop + async | Workshop + async |
Outputdifferent | Journey Map, Pain-point List, Opportunity Backlog | Decision Matrix, Scoring Rationale, Selected Option | RICE Scores, Ranked List, Assumption Log |
Tagsno overlap | JourneyServiceService design | DecisionCriteriaScoringTradeoffs | PrioritizationScoringRoadmapTradeoffs |
Often compared together
Methods with strong topical overlap with the current selection, not yet in the comparison.