View methods side by side.
Choose up to four methods. Add them using the search and share the comparison by copying its link.
| Criterion | 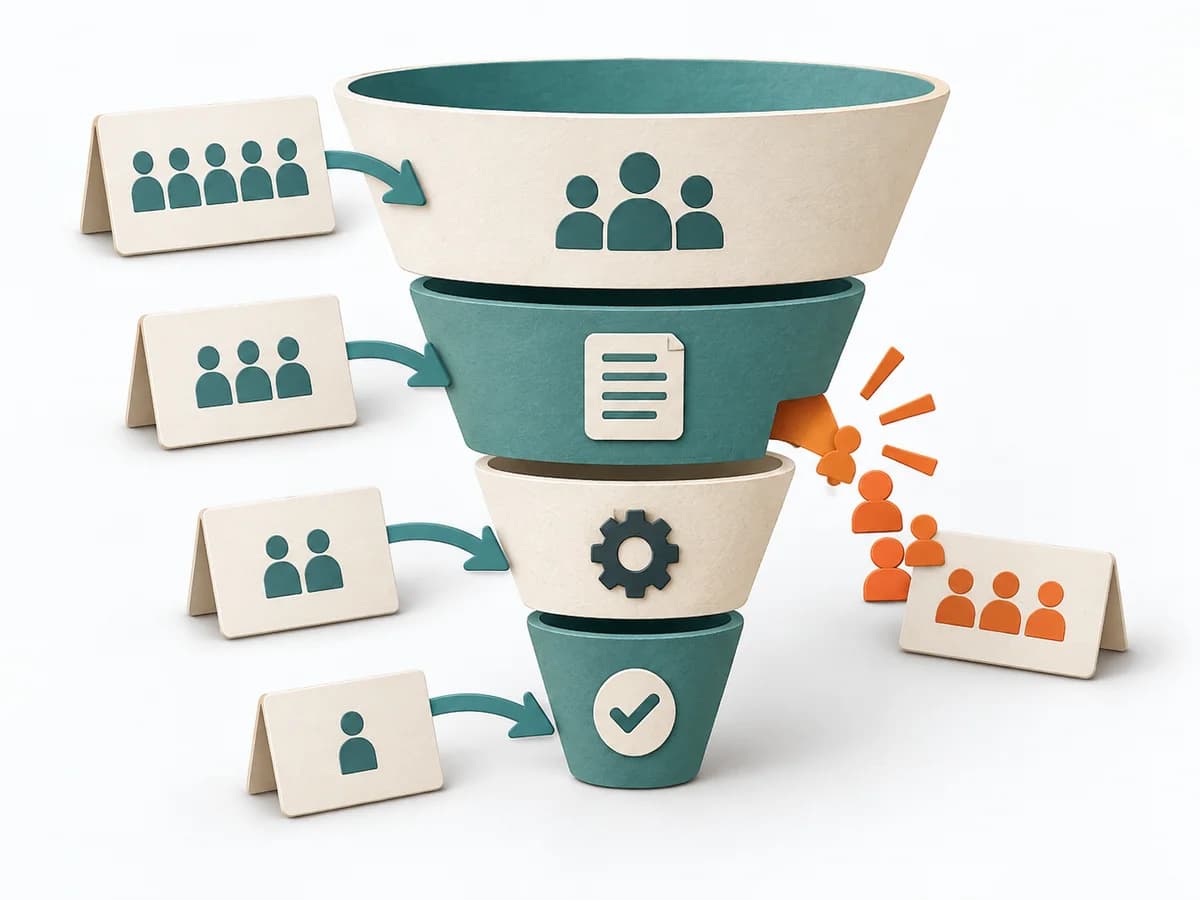 Growth Funnel Analysis |  Team Design Team Topologies Interaction Modes |  Growth Flywheel |
|---|---|---|---|
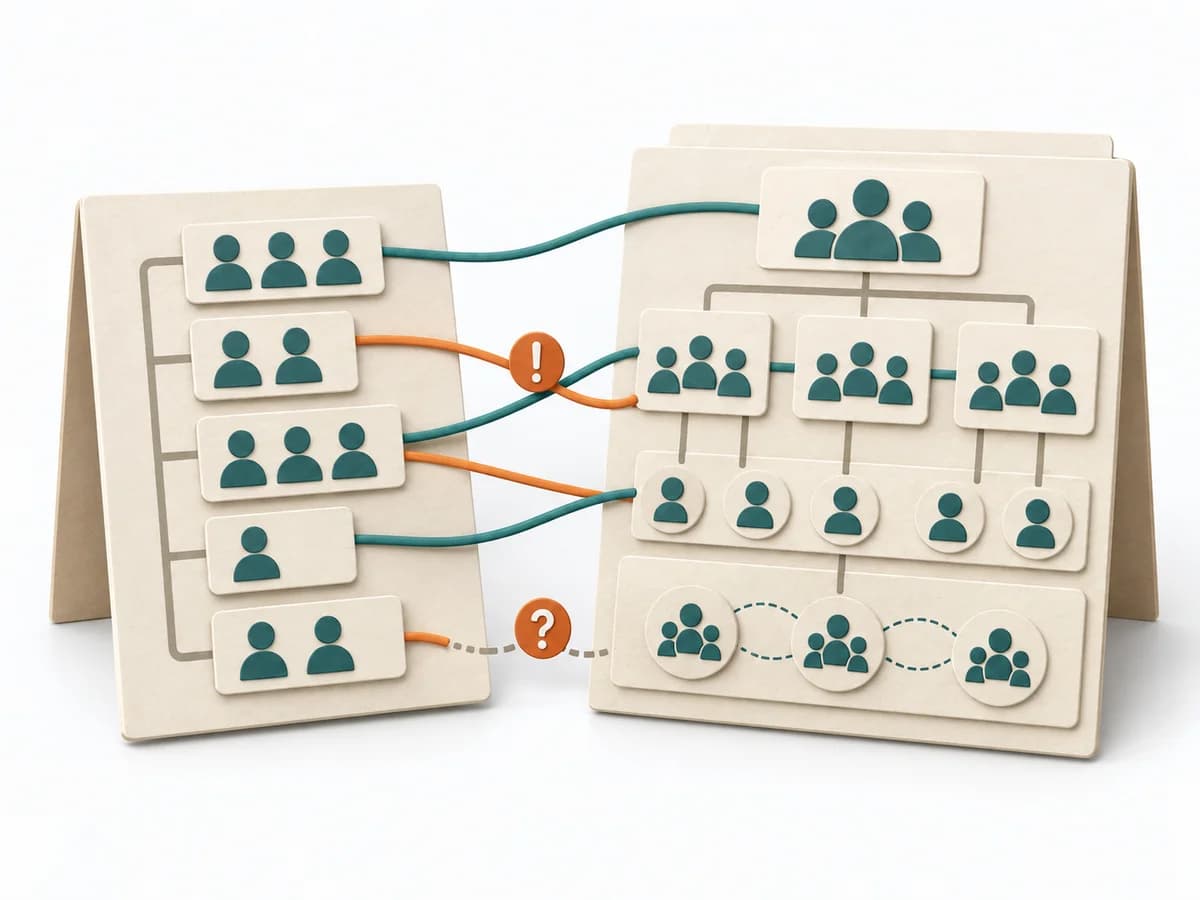
Purposedifferent | When many visitors or users drop off along the way, the reason behind the number often stays hidden. Funnel Analysis exposes these transitions and makes visible exactly where the path collapses. | When several teams collaborate repeatedly, it describes the right interaction mode for each interface between them. It clarifies responsibility, interaction, and load between teams. The result is captured as an interaction heat map and pairwise agreements. | Growth often breaks down where a reinforcing mechanism builds up too much friction. A Flywheel shows the cycle of value, repetition, and reinforcement meant to sustain growth. |
Complexitysame | Medium | Medium | Medium |
Timedifferent | 1-3 h | Half day | 60-120 min |
Participantsdifferent | 1-5 | Team-Leads plus Architecture | 3-8 |
Formatdifferent | Async | Workshop | Workshop |
Outputdifferent | Funnel report, Drop-off analysis, Optimization hypotheses | Interaction Heat Map, Agreements per Pair | Flywheel Map, Friction Points, Growth Levers, Experiment Backlog |
Tagsno overlap | AnalyticsConversionGrowth | TeamAlignmentCollaborationOrganization | GrowthRetentionConversion |
Often compared together
Methods with strong topical overlap with the current selection, not yet in the comparison.