View methods side by side.
Choose up to four methods. Add them using the search and share the comparison by copying its link.
| Criterion |  Growth Funnel Analysis |  Product Strategy OKRs | 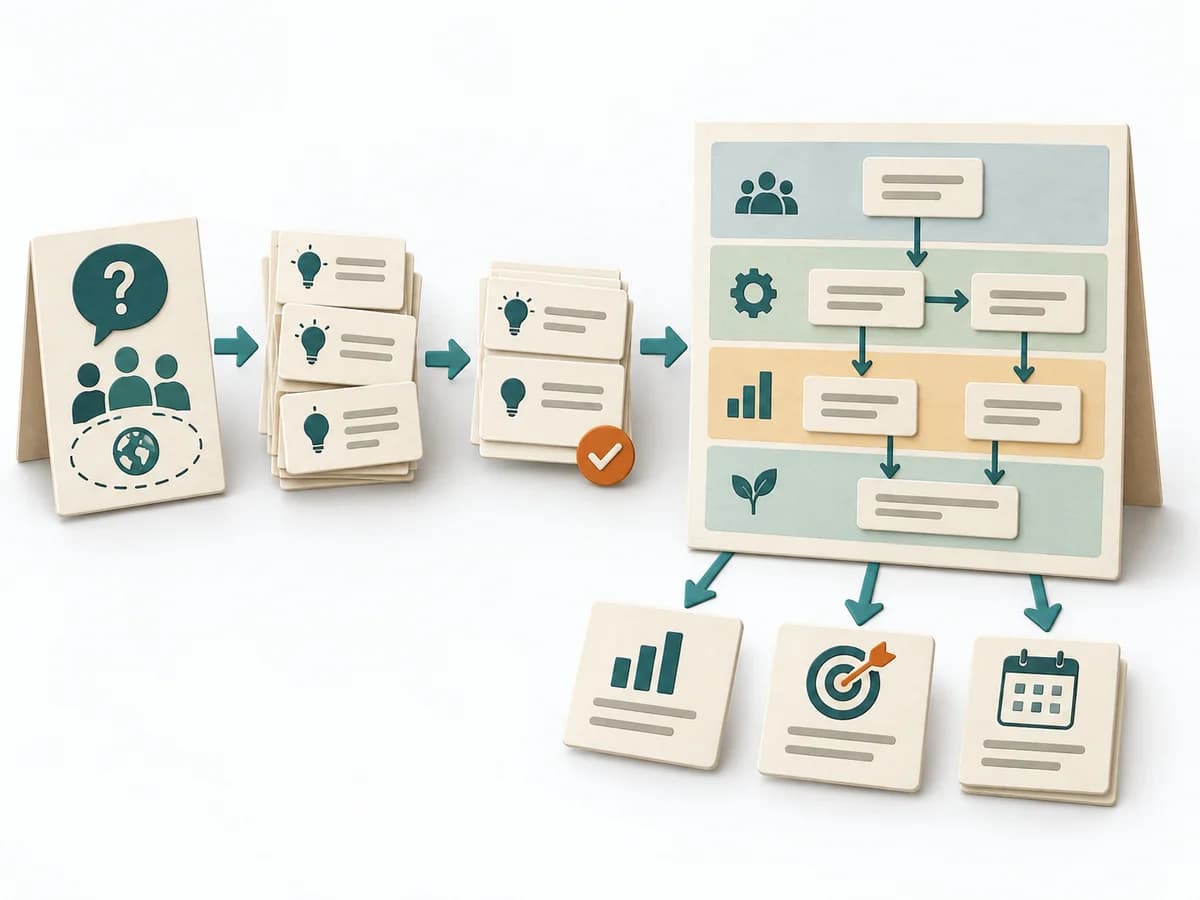 Business Strategy Strategy Map |
|---|---|---|---|
Purposedifferent | When many visitors or users drop off along the way, the reason behind the number often stays hidden. Funnel Analysis exposes these transitions and makes visible exactly where the path collapses. | When strategic direction needs to become measurable, it connects ambition with checkable results. It makes goals connectable to focus and review. | A Strategy Map translates strategy into a few connected objectives across perspectives such as finance, customers, processes, and learning. This makes visible which capabilities and activities are meant to drive which results. |
Complexitysame | Medium | Medium | Medium |
Timedifferent | 1-3 h | 1-2 h Setup | 2-4 h workshop plus review |
Participantsdifferent | 1-5 | 2-20 | 4-10 |
Formatdifferent | Async | Workshop + async | Workshop |
Outputdifferent | Funnel report, Drop-off analysis, Optimization hypotheses | OKR set, Measurement plan, Review cadence | Strategy Map, Objective Set, Cause-Effect Hypotheses |
Tagsno overlap | AnalyticsConversionGrowth | GoalsAlignmentOutcomesMeasurement | AlignmentExecutionGoalsCausality |
Often compared together
Methods with strong topical overlap with the current selection, not yet in the comparison.