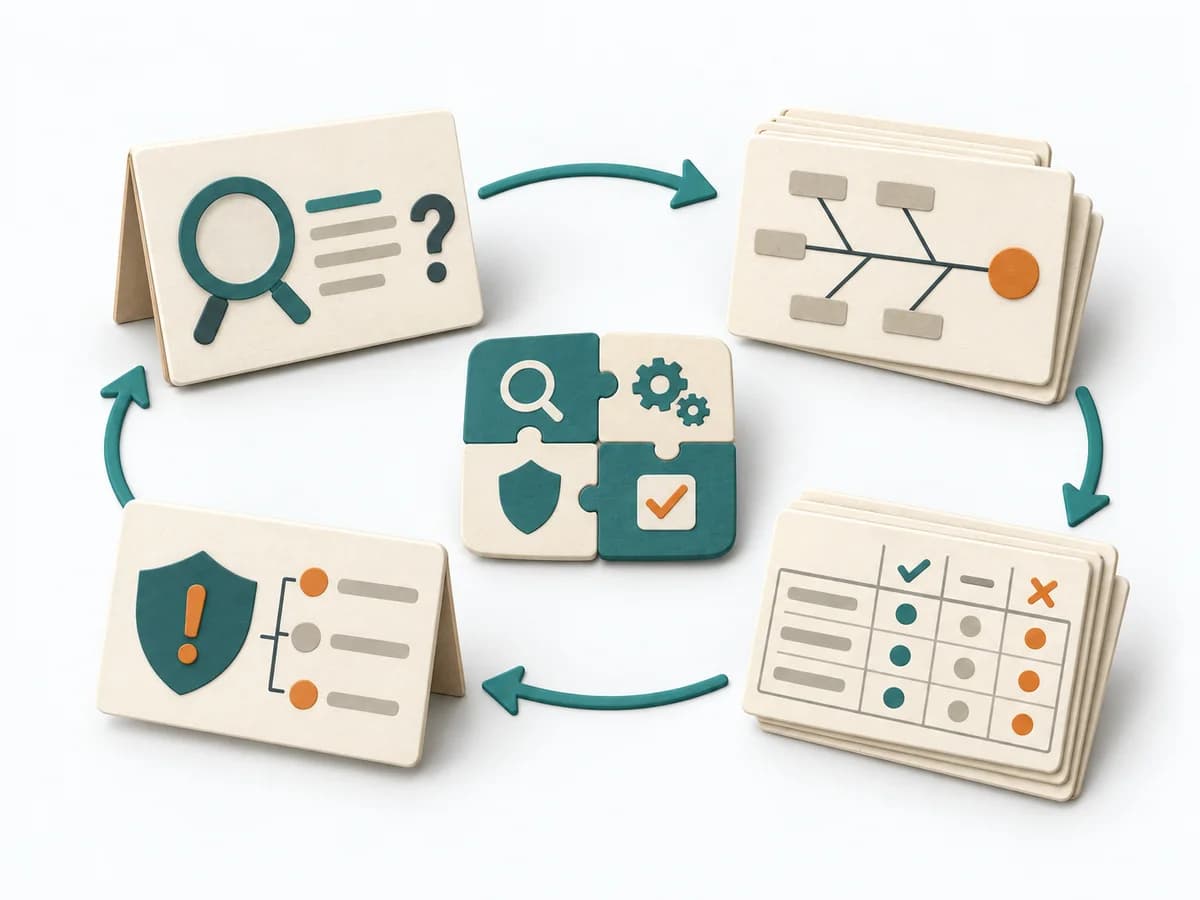
View methods side by side.
Choose up to four methods. Add them using the search and share the comparison by copying its link.
| Criterion | 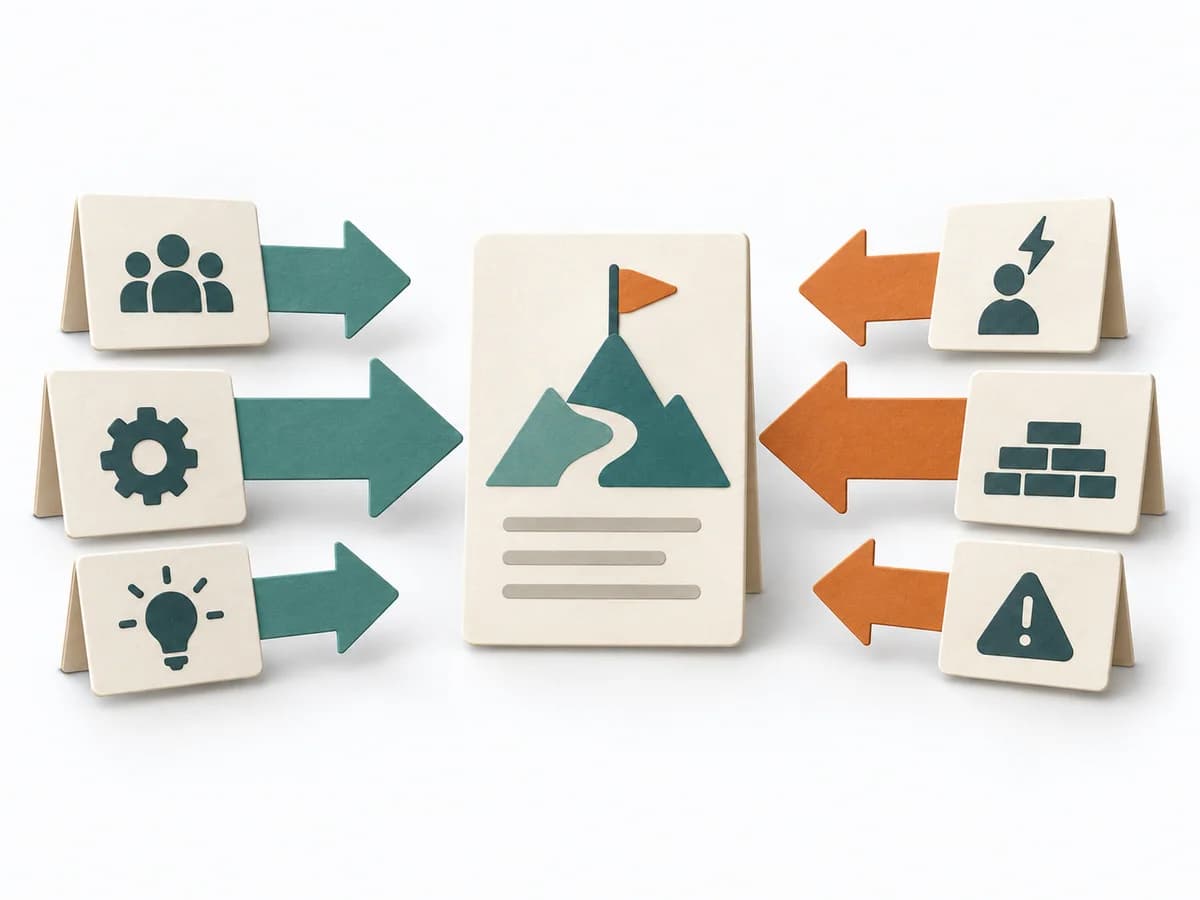 Decision Making Force Field Analysis |  Operations Fishbone Diagram |  Operations Change Analysis |
|---|---|---|---|
Purposedifferent | In change initiatives, supporting and restraining forces sit at the table at the same time. Force Field Analysis makes these tensions explicit and shows where change can be pushed forward by strengthening or relieving. | When a problem has several possible contributing factors, the method sorts causes by cause areas. It prevents an initial hunch from blocking the view of other plausible drivers. | For a deviation after a change, the method isolates the influence of the altered condition. It narrows down which differences are relevant and which are just accompanying noise. |
Complexitydifferent | Low | Low | Medium |
Timedifferent | 45-90 min | 30-60 min | 45-120 min |
Participantsdifferent | 3-12 | 2-8 | 2-6 |
Formatdifferent | Workshop | Workshop | Workshop + async |
Outputdifferent | Force Field Map, Change Levers, Risk Notes | Fishbone Diagram, Cause Categories, Investigation Backlog | Change Matrix, Cause Hypotheses, Validation Questions, Action List |
Tagsno overlap | ChangeDecisionStrategy | Root causeQualityOperations | ChangeRoot causeTroubleshootingComparison |
Often compared together
Methods with strong topical overlap with the current selection, not yet in the comparison.