View methods side by side.
Choose up to four methods. Add them using the search and share the comparison by copying its link.
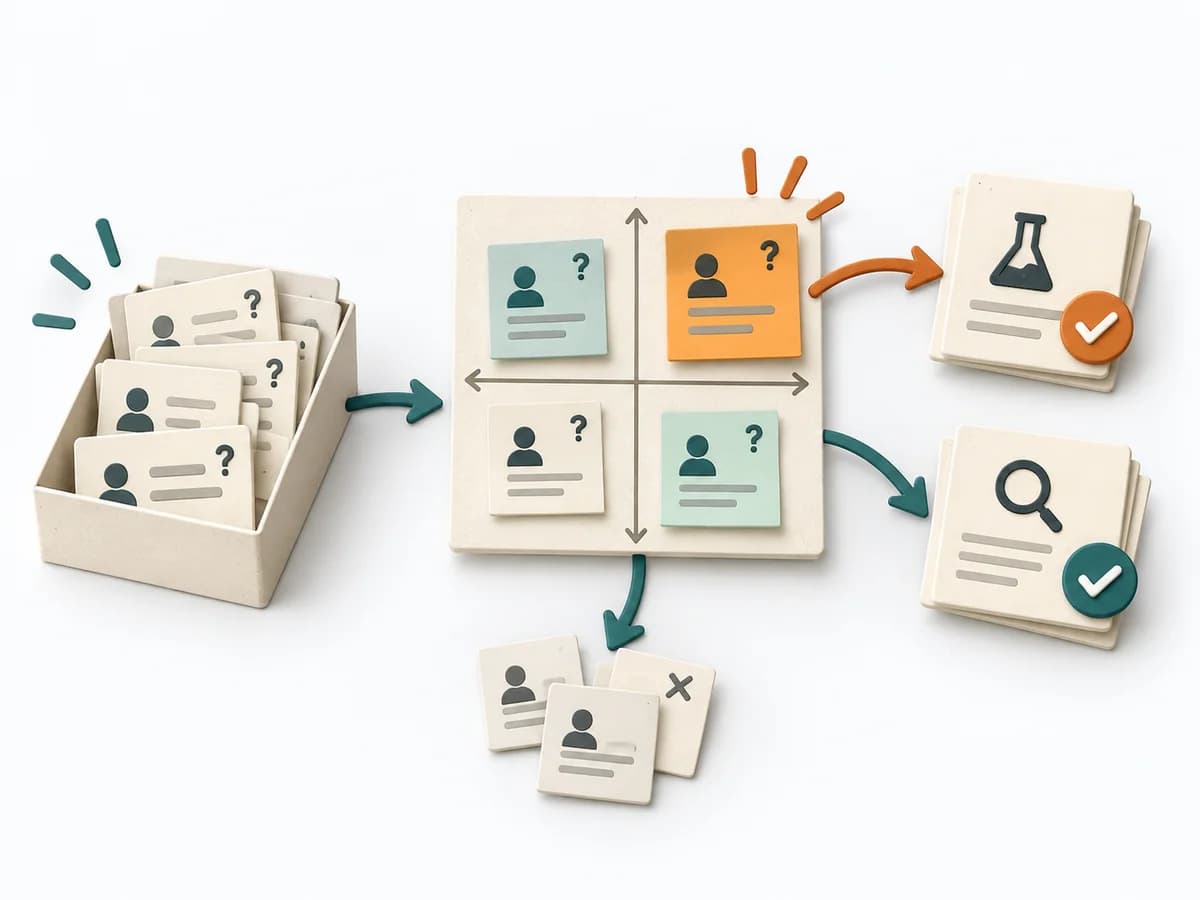
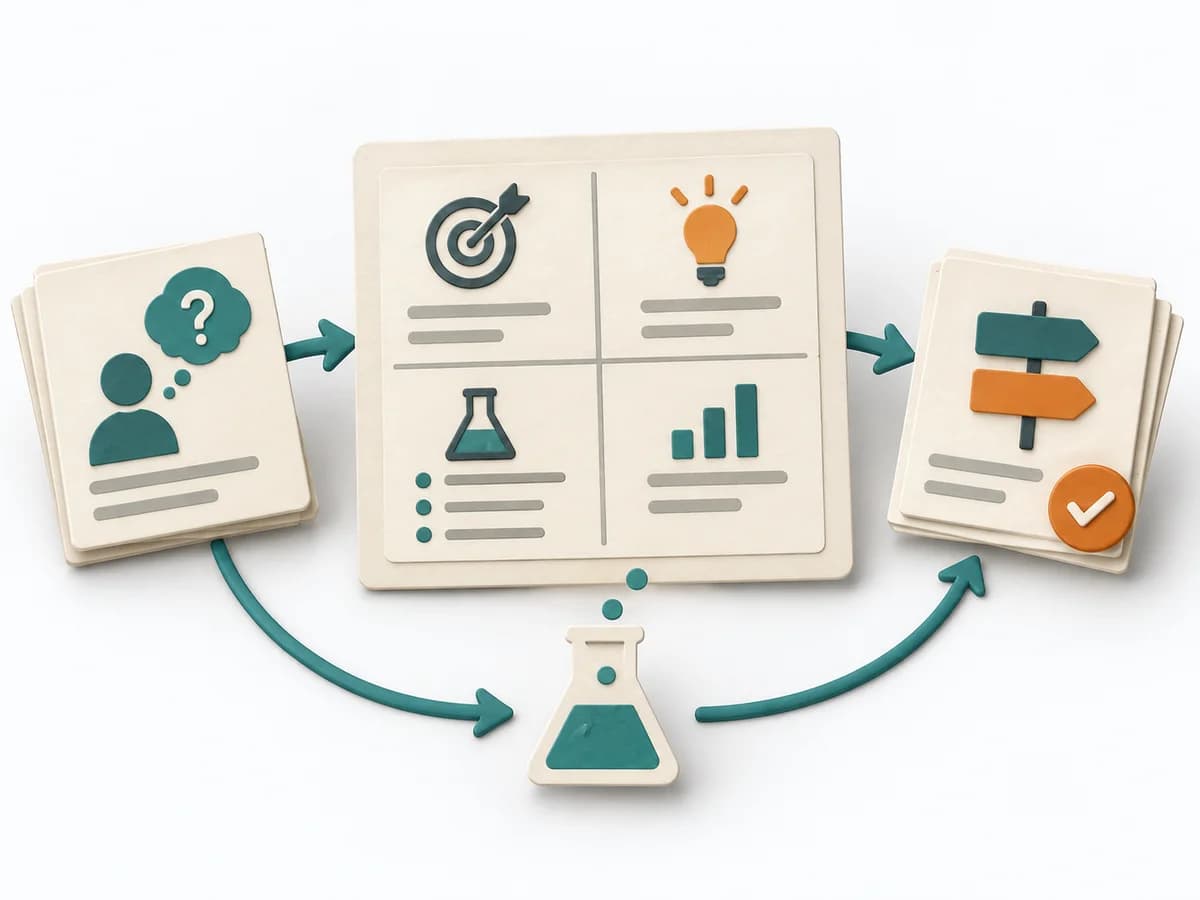
| Criterion |  Operations Failure Mode and Effects Analysis | 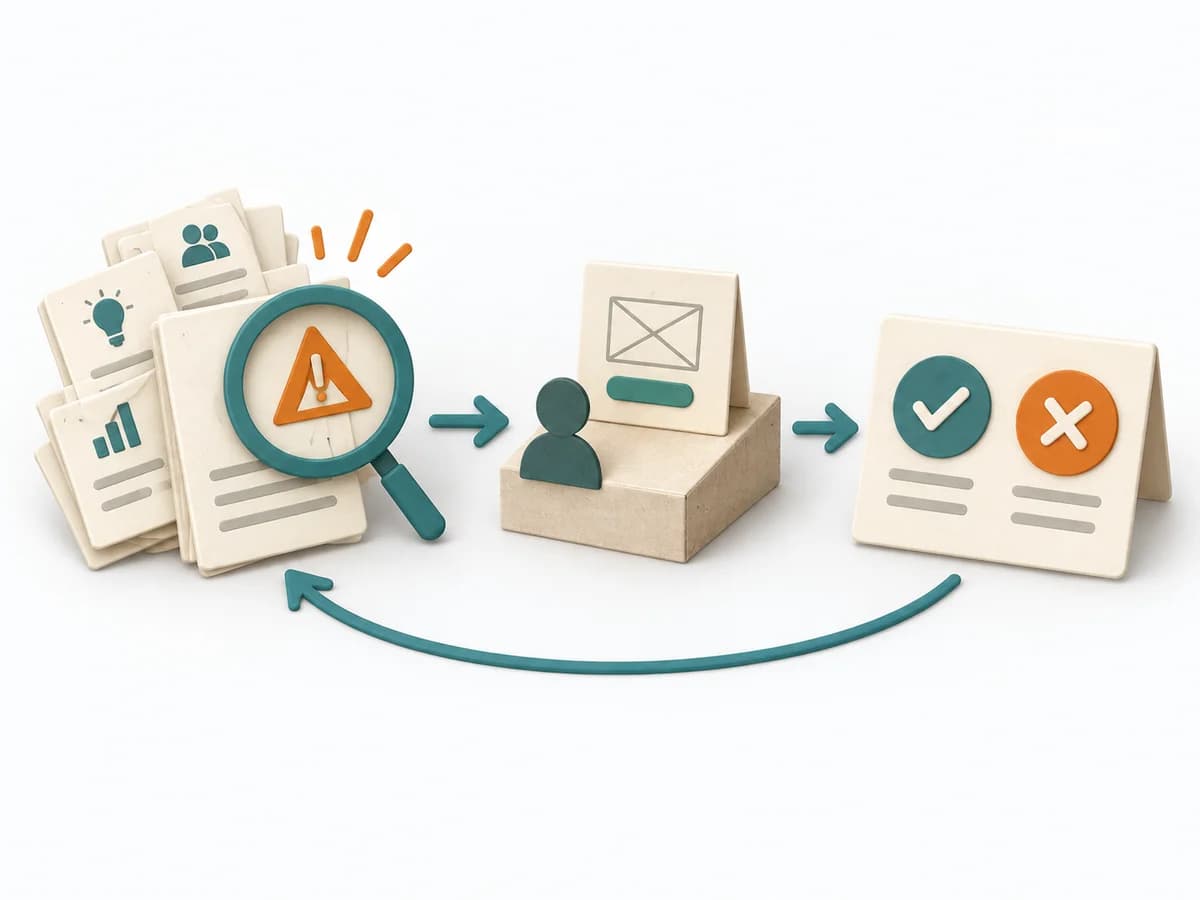 Product Discovery Riskiest Assumption Test | 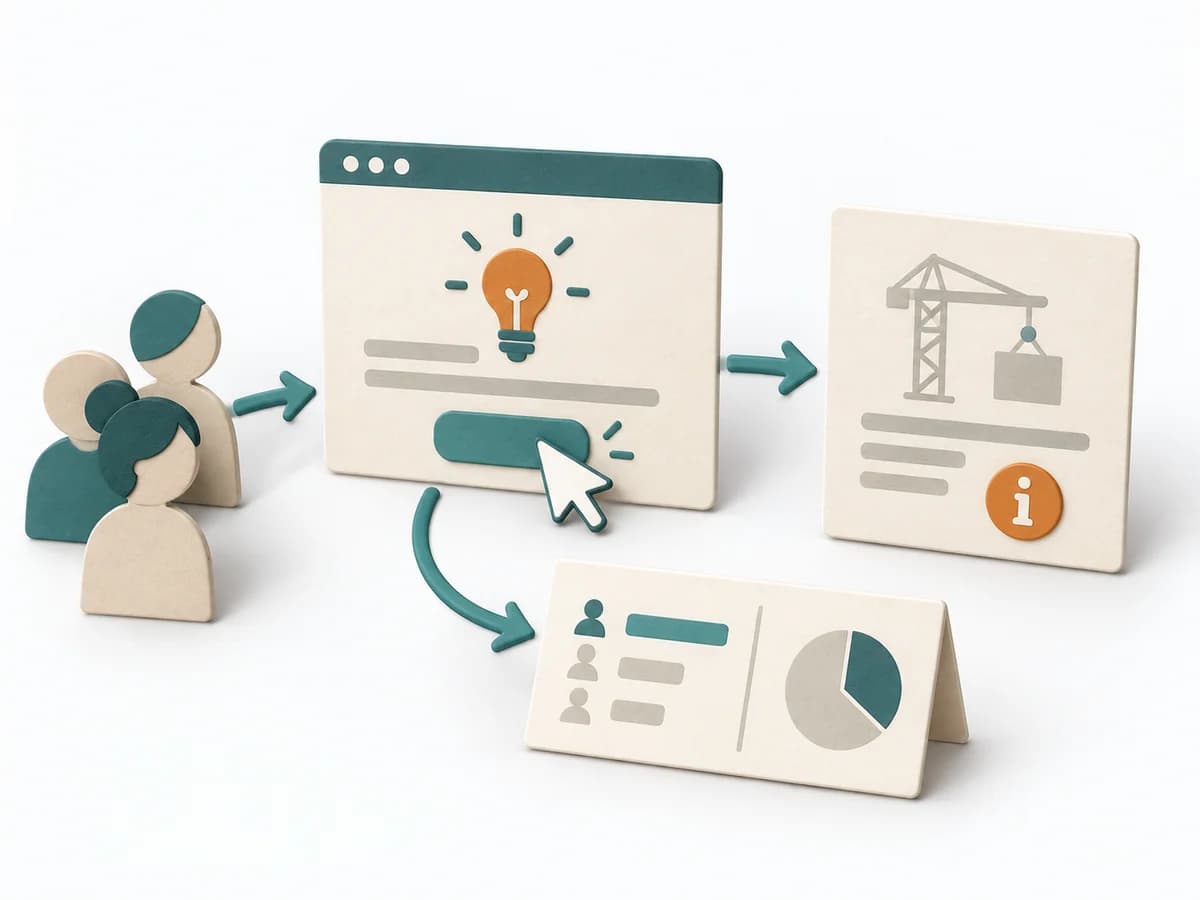 Product Discovery Fake Door Test |
|---|---|---|---|
Purposedifferent | For a process, product, or service with noticeable failure risks, the method assesses possible failure modes in advance. It directs attention to combinations of occurrence, effect, and detectability. | When an idea hinges on one critical unknown, it prioritizes testing that exact piece of uncertainty first. It separates problem, assumption, solution, and evidence. The result is captured as a prioritized list of assumptions, a test plan, and a result report. | When demand is still unclear, it measures interest in a feature before it is built. It separates real behavior from polite agreement and deliberately keeps build effort small. |
Complexitydifferent | High | Medium | Medium |
Timedifferent | 2-6 h | 1-2 Wochen pro Iteration | 1-5 Tage |
Participantsdifferent | 3-10 | 2-6 | Nutzertraffic |
Formatdifferent | Workshop | Workshop + async | Async |
Outputdifferent | FMEA Table, Risk Priority, Mitigation Actions | Prioritized Assumption List, Test Plan, Results Report | Click Data, Interest Signal, Learning Decision |
Tagsno overlap | RiskQualityOperationsRoot cause | ExperimentsValidationDiscoveryAssumptions | ValidationExperimentsDemandDiscovery |
Often compared together
Methods with strong topical overlap with the current selection, not yet in the comparison.