View methods side by side.
Choose up to four methods. Add them using the search and share the comparison by copying its link.
| Criterion |  Growth Flywheel |  Product Strategy RICE Scoring | 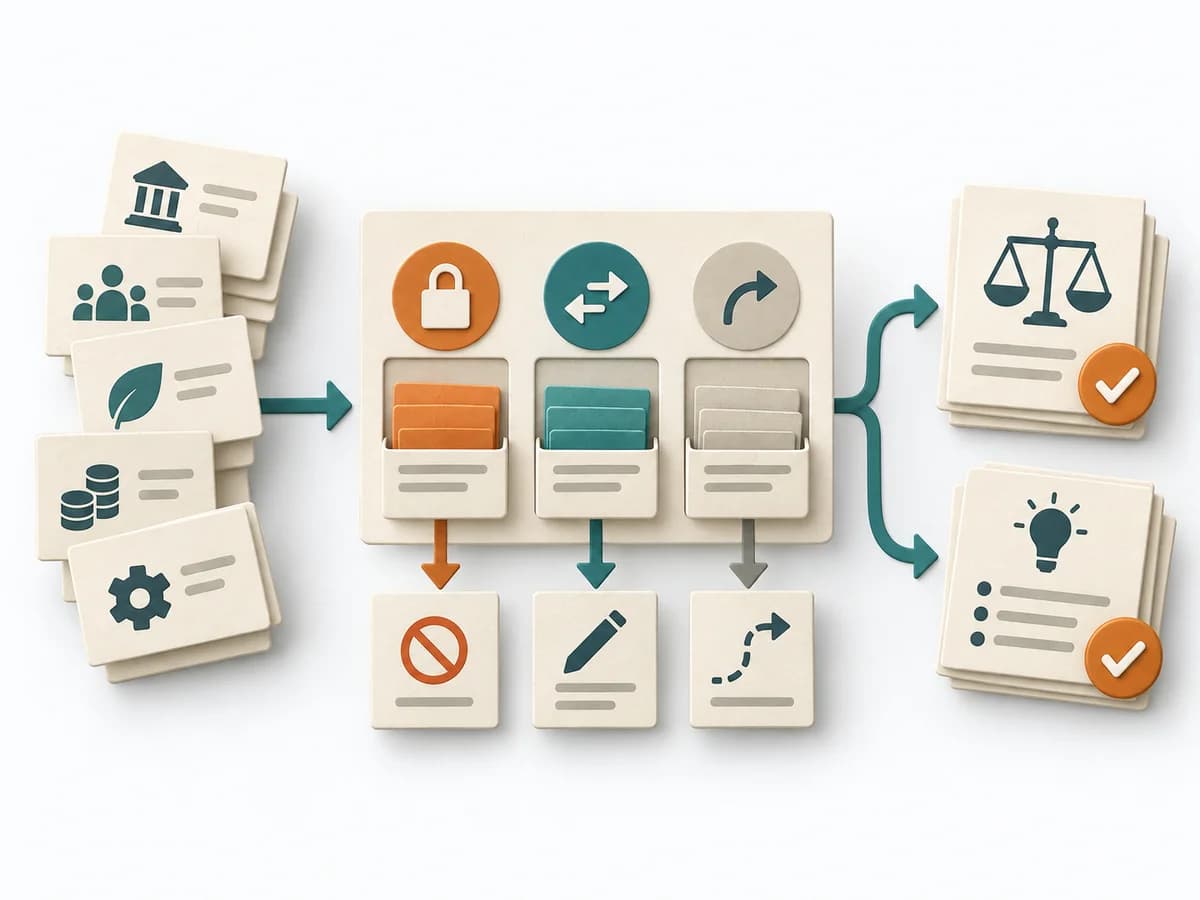 Decision Making Constraint Analysis |
|---|---|---|---|
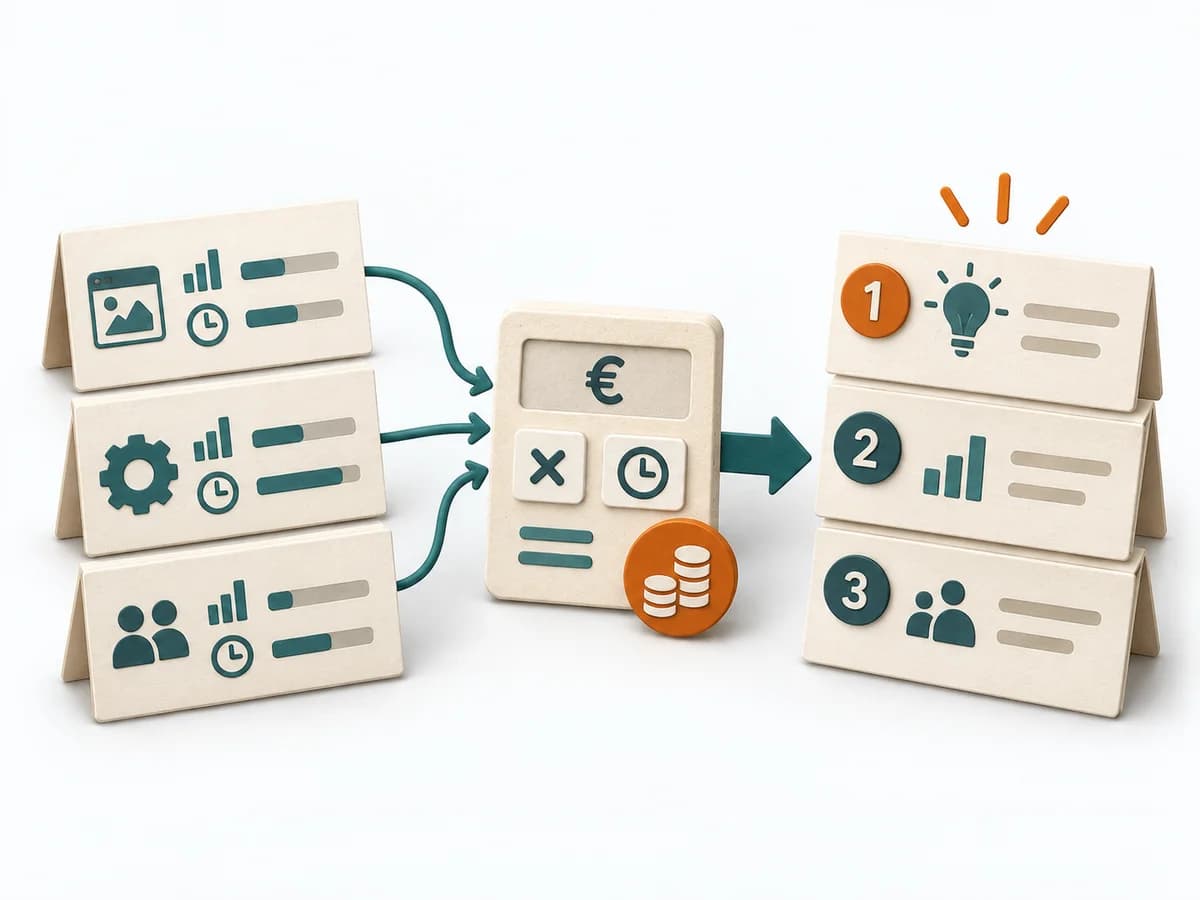
Purposedifferent | Growth often breaks down where a reinforcing mechanism builds up too much friction. A Flywheel shows the cycle of value, repetition, and reinforcement meant to sustain growth. | When many initiatives compete for the same resources, it brings reach, impact, confidence, and effort into one shared ranking. It makes prioritization economically connectable. | When an initiative stalls, the limit often lies not in the idea but in hard or soft boundary conditions. Constraint Analysis separates these limits and shows which of them can actually be shaped. |
Complexitydifferent | Medium | Medium | Low |
Timedifferent | 60-120 min | 60-90 min | 30-90 min |
Participantsdifferent | 3-8 | 2-10 | 2-8 |
Formatdifferent | Workshop | Workshop + async | Workshop + async |
Outputdifferent | Flywheel Map, Friction Points, Growth Levers, Experiment Backlog | RICE Scores, Ranked List, Assumption Log | Constraint List, Hard/Soft Classification, Option Impact Notes, Decision Boundaries |
Tagsno overlap | GrowthRetentionConversion | PrioritizationScoringRoadmapTradeoffs | ConstraintsDecisionPlanningOptions |
Often compared together
Methods with strong topical overlap with the current selection, not yet in the comparison.