View methods side by side.
Choose up to four methods. Add them using the search and share the comparison by copying its link.
| Criterion |  Facilitation Expectation Mapping |  DevOps Game Day | 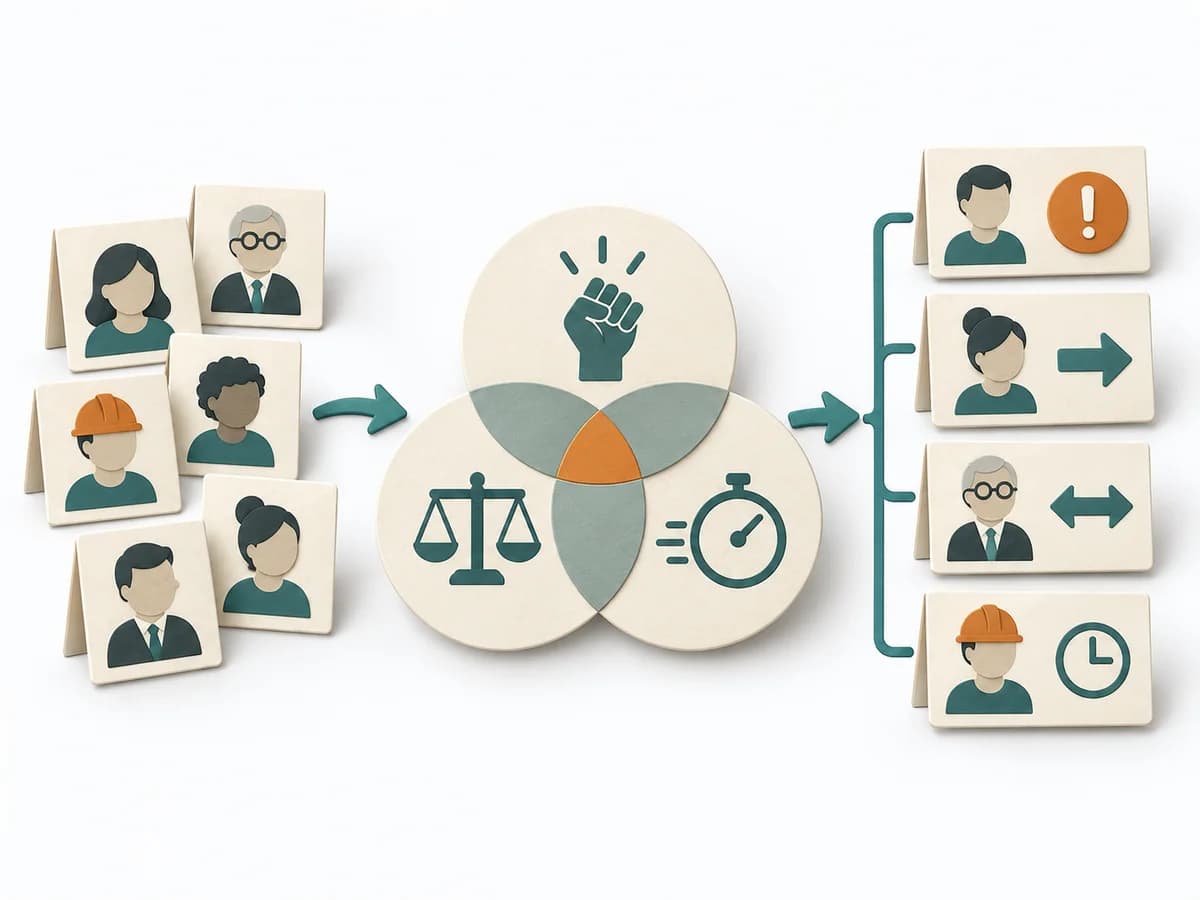 Facilitation Stakeholder Salience Model |
|---|---|---|---|
Purposedifferent | When roles, interfaces, or projects fail because of differing expectations, Expectation Mapping surfaces these differences. It shows what each side takes for granted and where the pictures diverge. | In preparing for rare incidents, the method tests response capability under controlled conditions. It shows where assumptions about stability, roles, and recovery are too optimistic. | When stakeholders appear to matter very differently, the Stakeholder Salience Model rates their actual priority through power, legitimacy, and urgency. It turns individual contributions into a visible selection. The result is captured as a Salience diagram and a class-based strategy. |
Complexitydifferent | Low | High | Medium |
Timedifferent | 45-90 min | Halber Tag | 60-90 min |
Participantsdifferent | 3-12 | 5-20 | 3-6 |
Formatsame | Workshop | Workshop | Workshop |
Outputdifferent | Expectation Map, Alignment Notes, Agreements | Simulation Notes, Gaps List, Updated Runbooks | Salience Diagram, Strategy per Class |
Tagsno overlap | AlignmentStakeholdersTeam | ResilienceOperationsIncident | StakeholdersFacilitationAlignmentGovernance |
Often compared together
Methods with strong topical overlap with the current selection, not yet in the comparison.



