View methods side by side.
Choose up to four methods. Add them using the search and share the comparison by copying its link.
| Criterion | 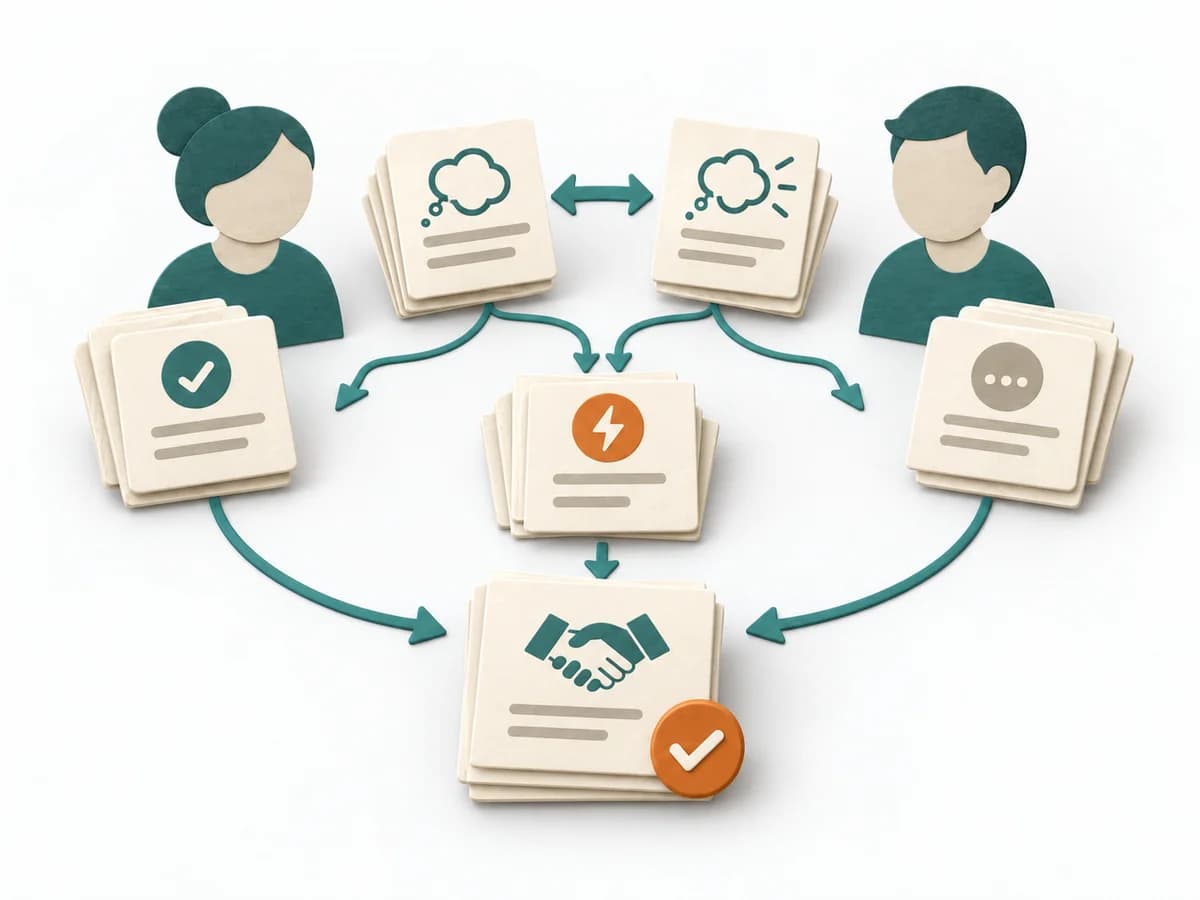 Facilitation Expectation Mapping | 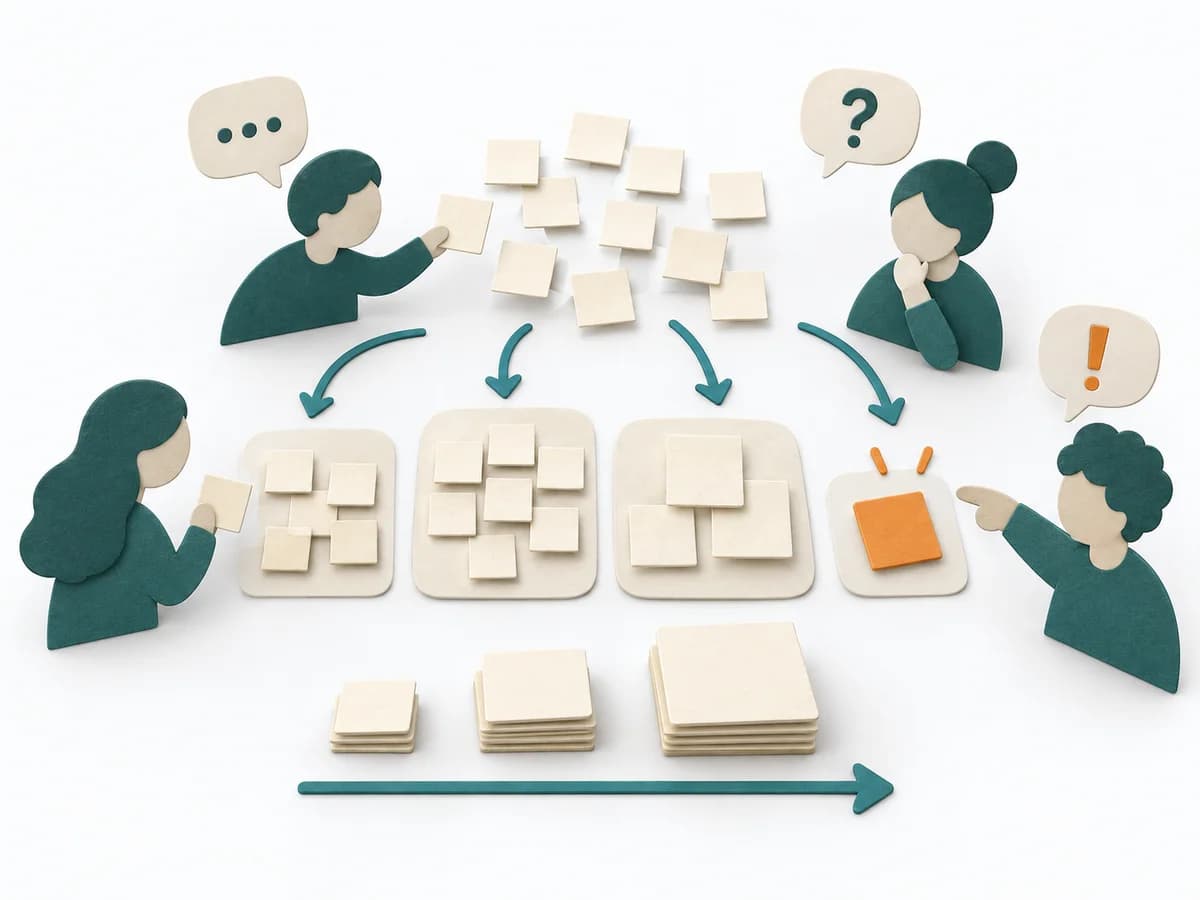 Agile Affinity Estimation |  Delivery Monte Carlo Forecasting |
|---|---|---|---|
Purposedifferent | When roles, interfaces, or projects fail because of differing expectations, Expectation Mapping surfaces these differences. It shows what each side takes for granted and where the pictures diverge. | When many tasks need to be classified quickly, it sorts them by perceived effort and similarity. It reduces the effort of fine-grained estimation for large volumes. | Helps clarify scope, sequence, and delivery flow in concrete terms. It makes work, boundaries, and order steerable. The result is captured as Forecast Percentiles, Throughput Dataset, and Risk Communication. |
Complexitydifferent | Low | Medium | High |
Timedifferent | 45-90 min | 30-90 min | 30-90 min Setup, danach laufend |
Participantsdifferent | 3-12 | 3-12 | 1-8 |
Formatdifferent | Workshop | Workshop | Workshop + async |
Outputdifferent | Expectation Map, Alignment Notes, Agreements | Affinity Size Map, Grouped Estimates, Unclear Items | Forecast Percentiles, Throughput Dataset, Risk Communication |
Tagsno overlap | AlignmentStakeholdersTeam | EstimationBacklogRelative sizing | ForecastingFlowDelivery |
Often compared together
Methods with strong topical overlap with the current selection, not yet in the comparison.