View methods side by side.
Choose up to four methods. Add them using the search and share the comparison by copying its link.
| Criterion | 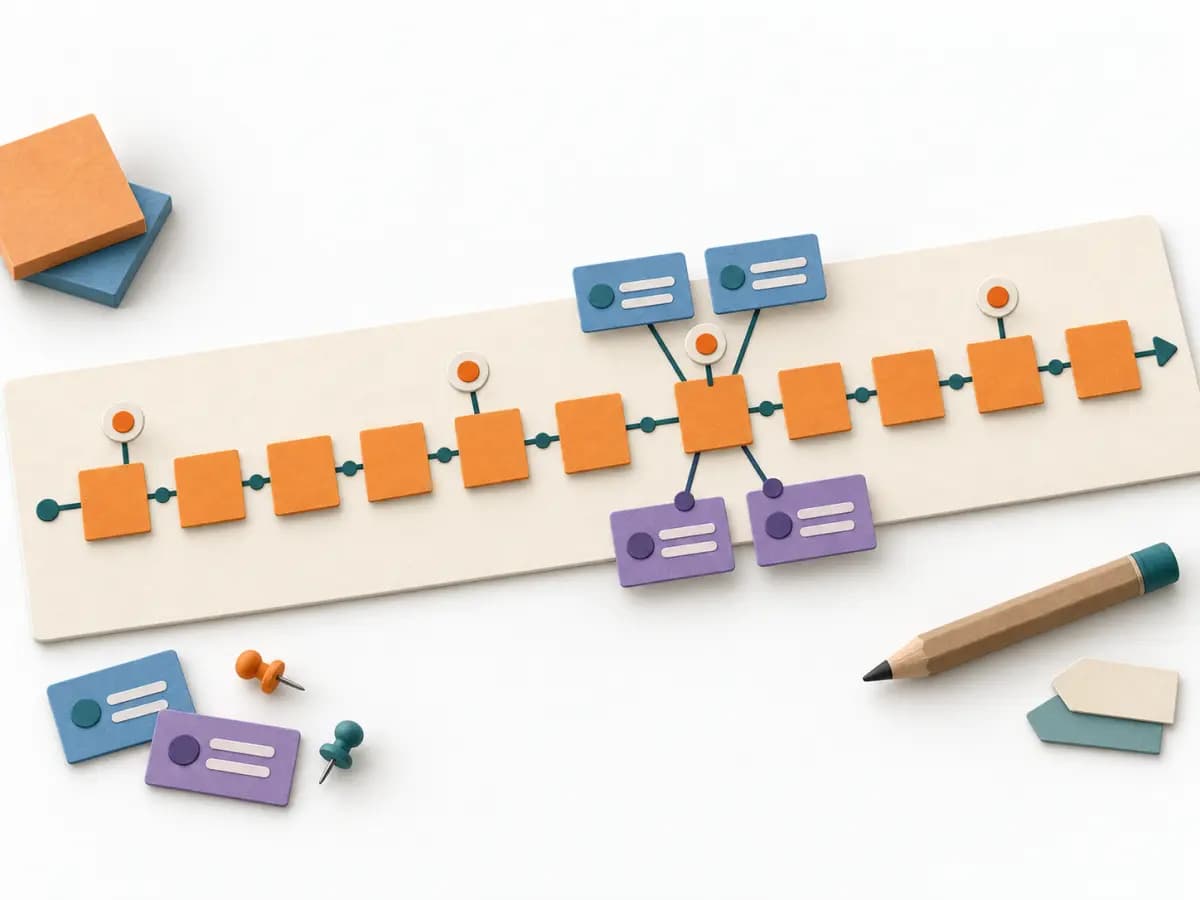 Domain Modeling EventStorming | 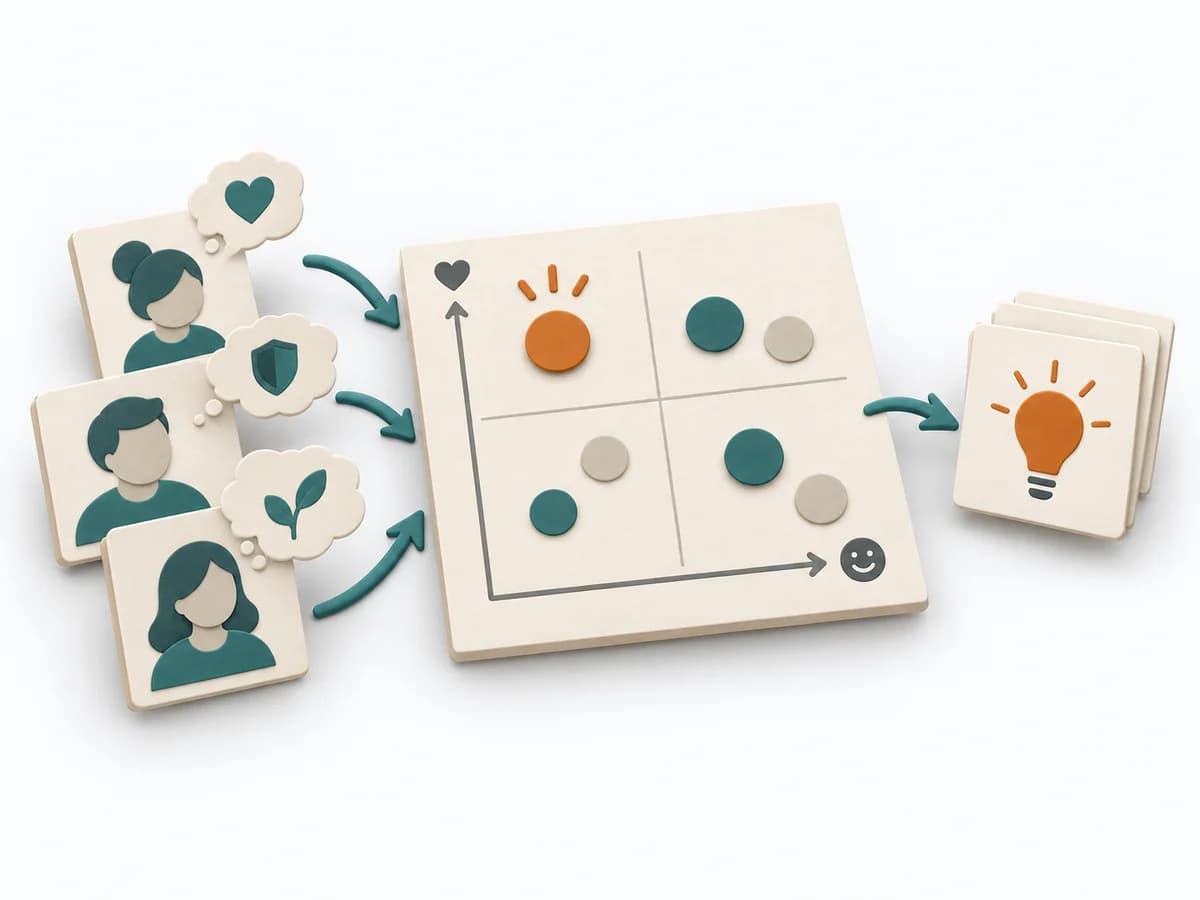 Product Discovery Outcome-Driven Innovation | 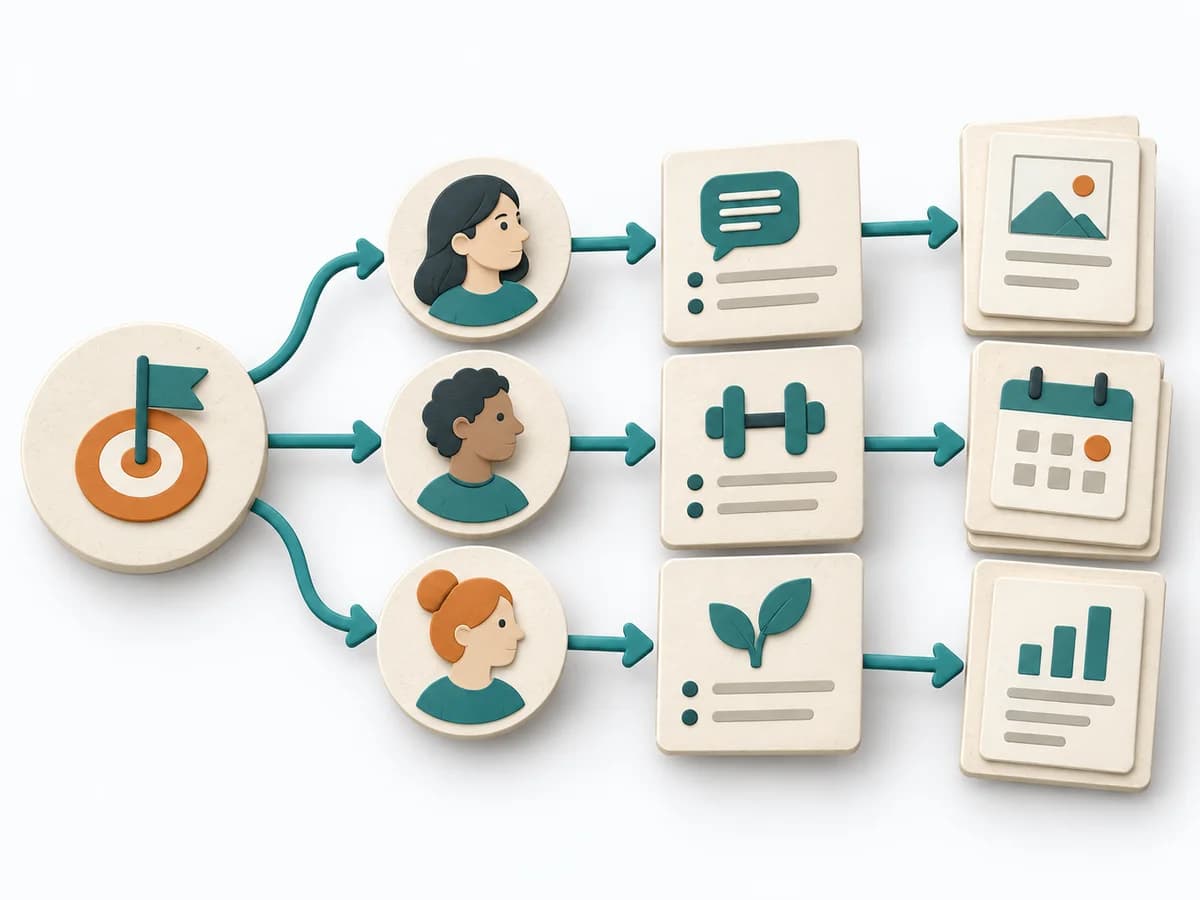 Product Strategy Impact Mapping |
|---|---|---|---|
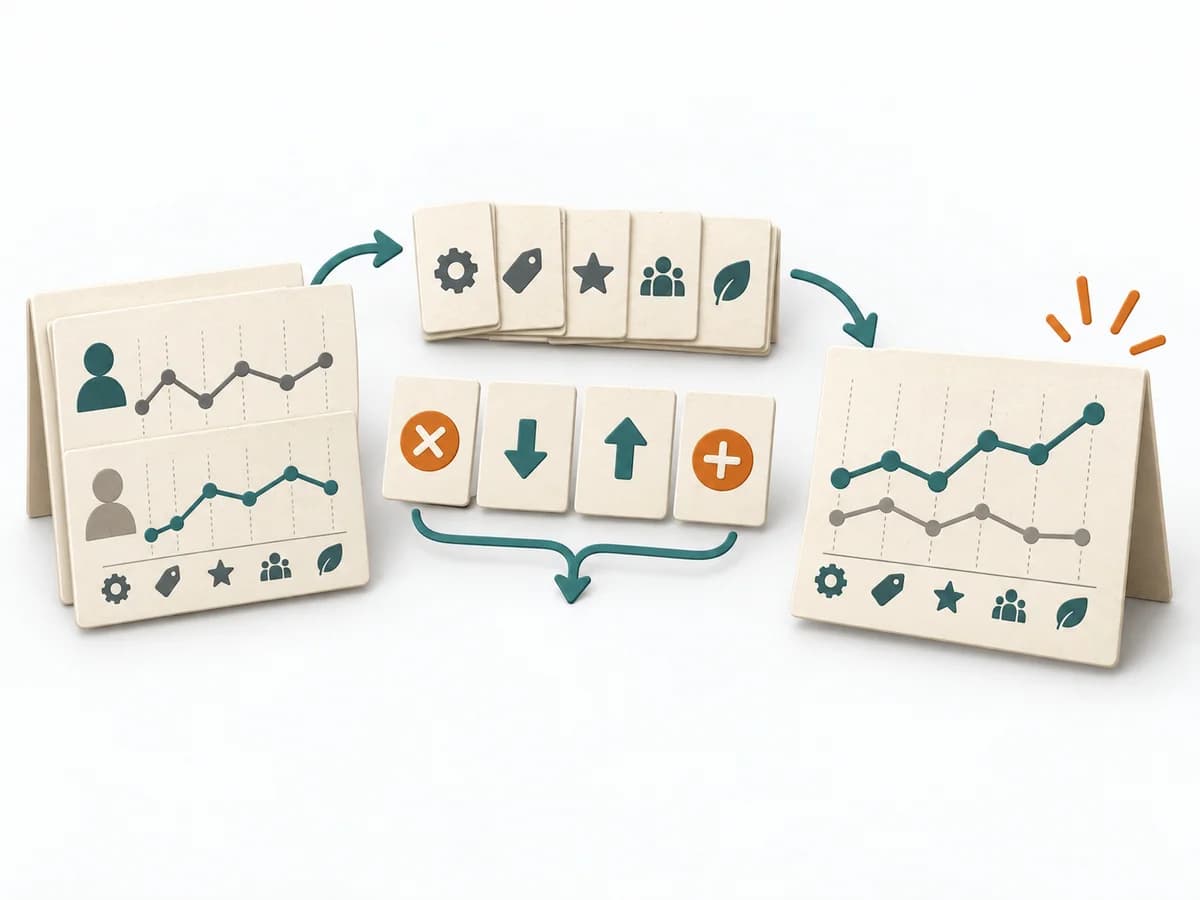
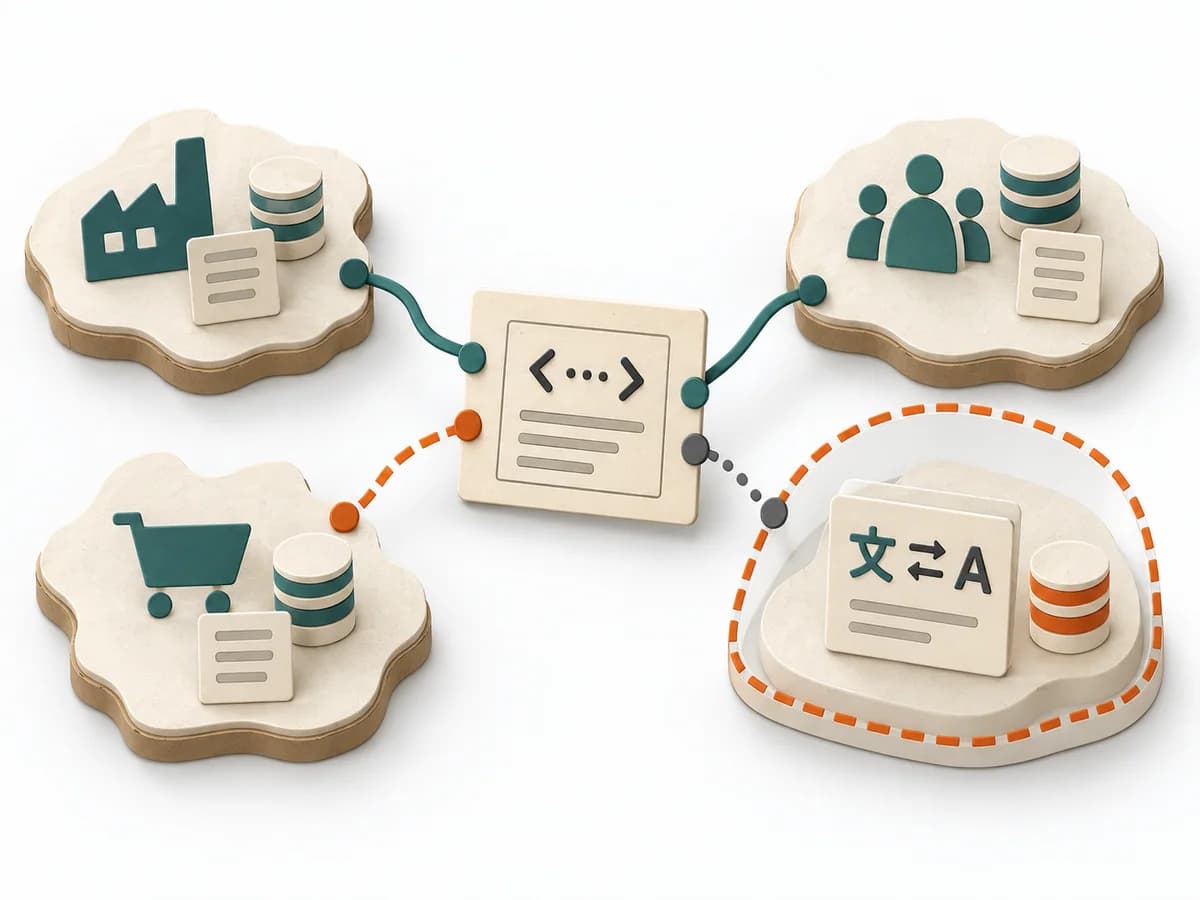
Purposedifferent | When a domain consists of many events, rules, and states, it creates a shared modeling space for the team. It bundles language, flows, and boundaries before domain knowledge fragments into siloed views. | Outcome-Driven Innovation clarifies customer problems, solution opportunities, and evidence. It separates jobs, desired outcomes, importance, satisfaction, and opportunity, and captures results as desired outcome statements, an opportunity landscape, and segments by underserved needs. | When a goal needs to be connected to several possible paths, it shows chains of impact instead of feature lists. It connects business goal, behavior change, and measures. |
Complexitydifferent | Medium | High | Medium |
Timedifferent | 2-8 h | Mehrere Wochen | 45-90 min |
Participantsdifferent | 5-12 | 2-6 researchers plus sample | 3-8 |
Formatdifferent | Workshop | Workshop + async | Workshop |
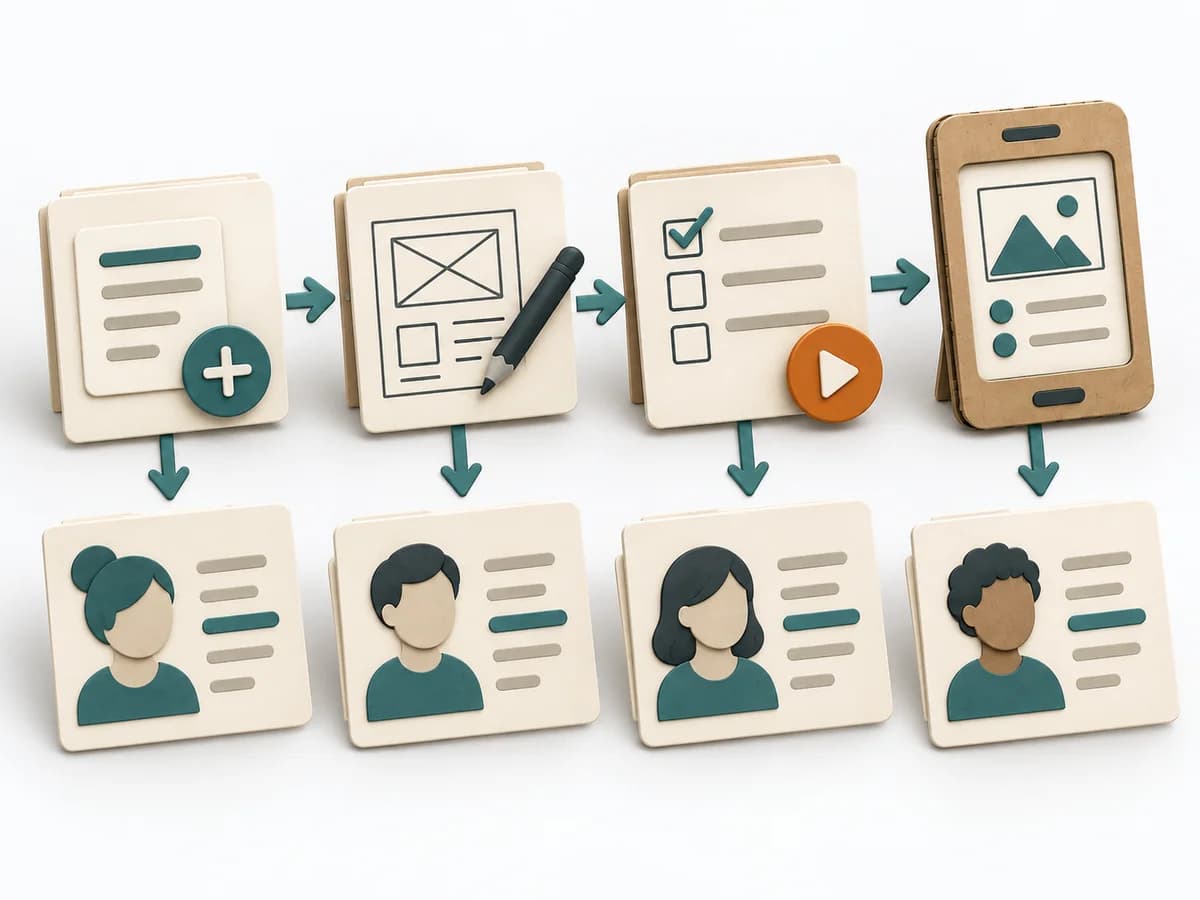
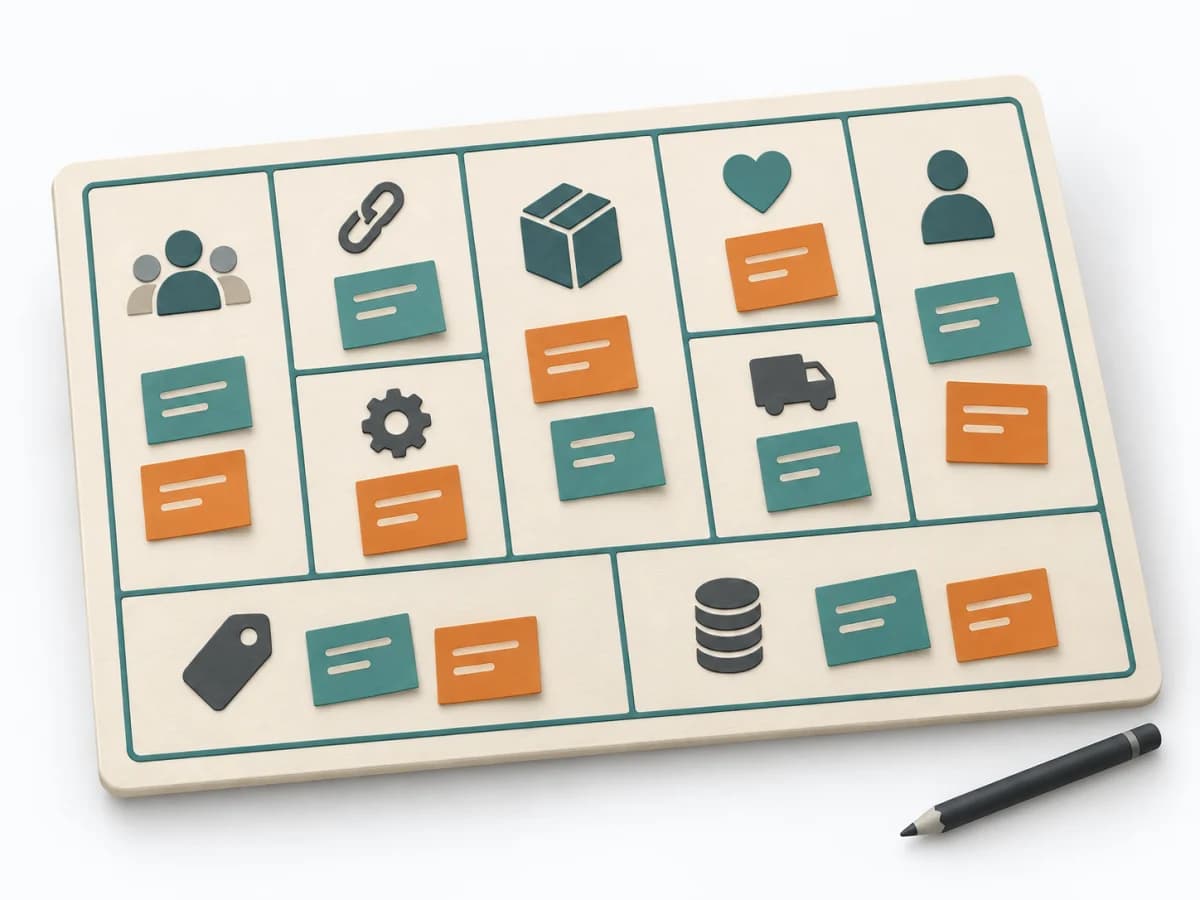
Outputdifferent | Event Timeline, Ubiquitous Language, Boundaries, Open Questions | Desired outcome statements, Opportunity landscape, Segmentation by underserved needs, Innovation hypotheses | Impact Map, Outcome Hypotheses, Delivery Options |
Tagsno overlap | Domain-Driven DesignEventsDiscoveryWorkshop | OutcomesInnovationResearchQuantitative | OutcomesStrategyBehaviorPlanning |
Often compared together
Methods with strong topical overlap with the current selection, not yet in the comparison.