View methods side by side.
Choose up to four methods. Add them using the search and share the comparison by copying its link.
| Criterion |  Knowledge Modeling Event Modeling | 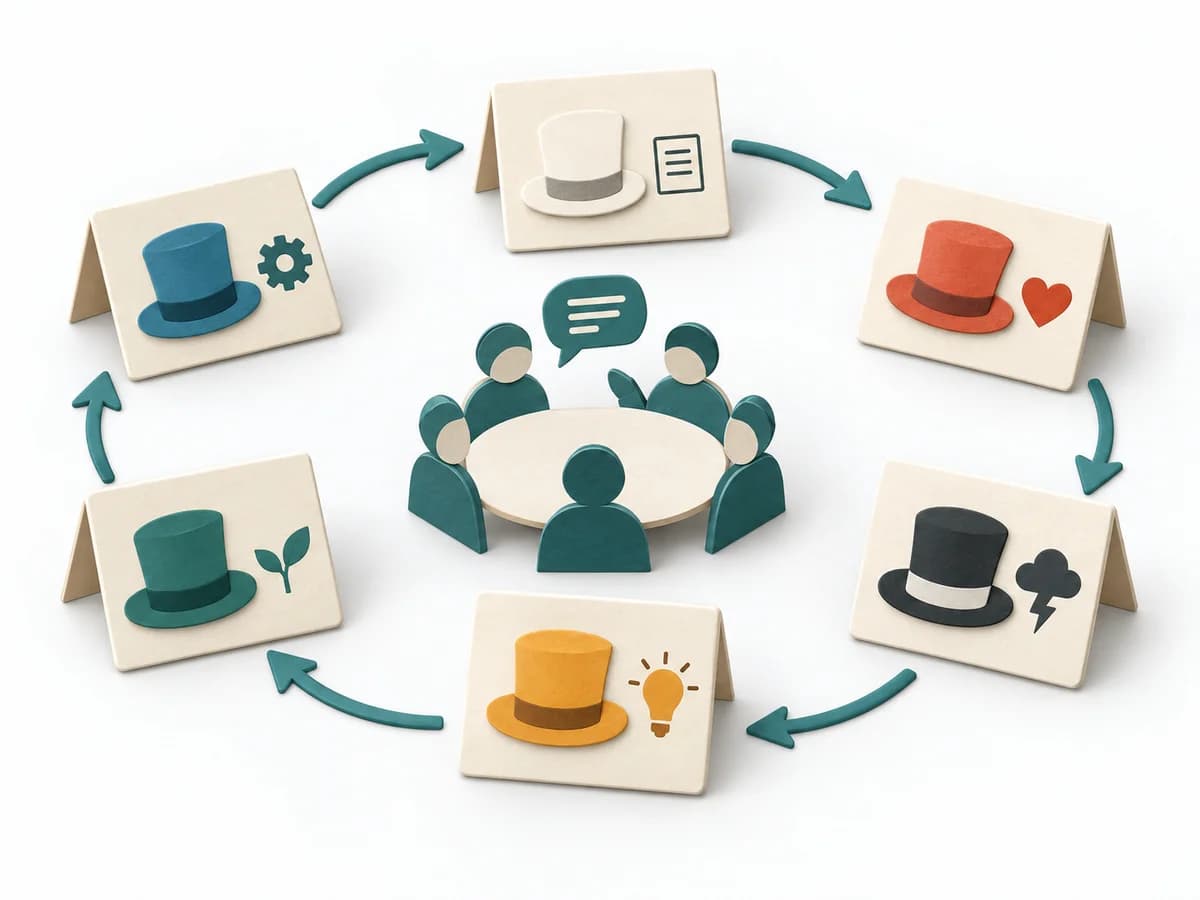 Facilitation Six Thinking Hats | 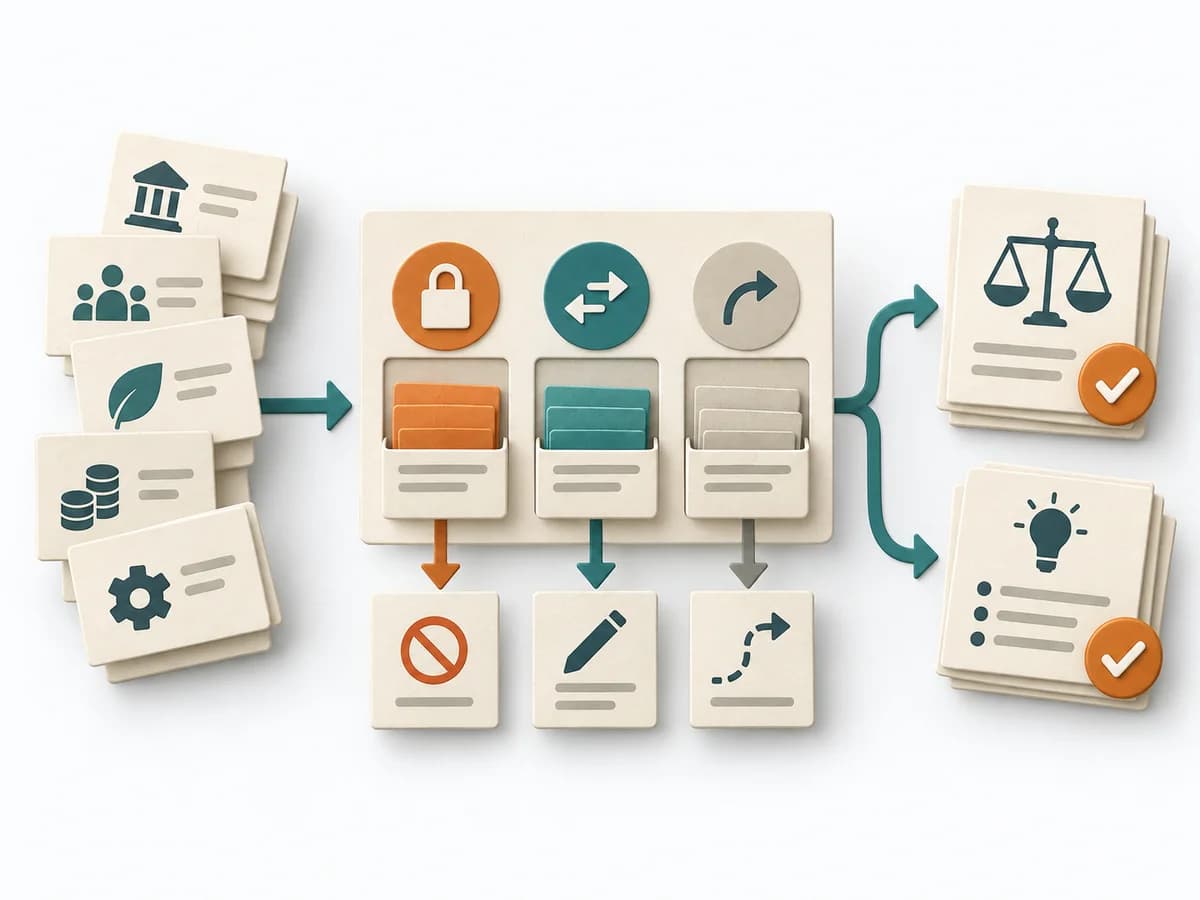 Decision Making Constraint Analysis |
|---|---|---|---|
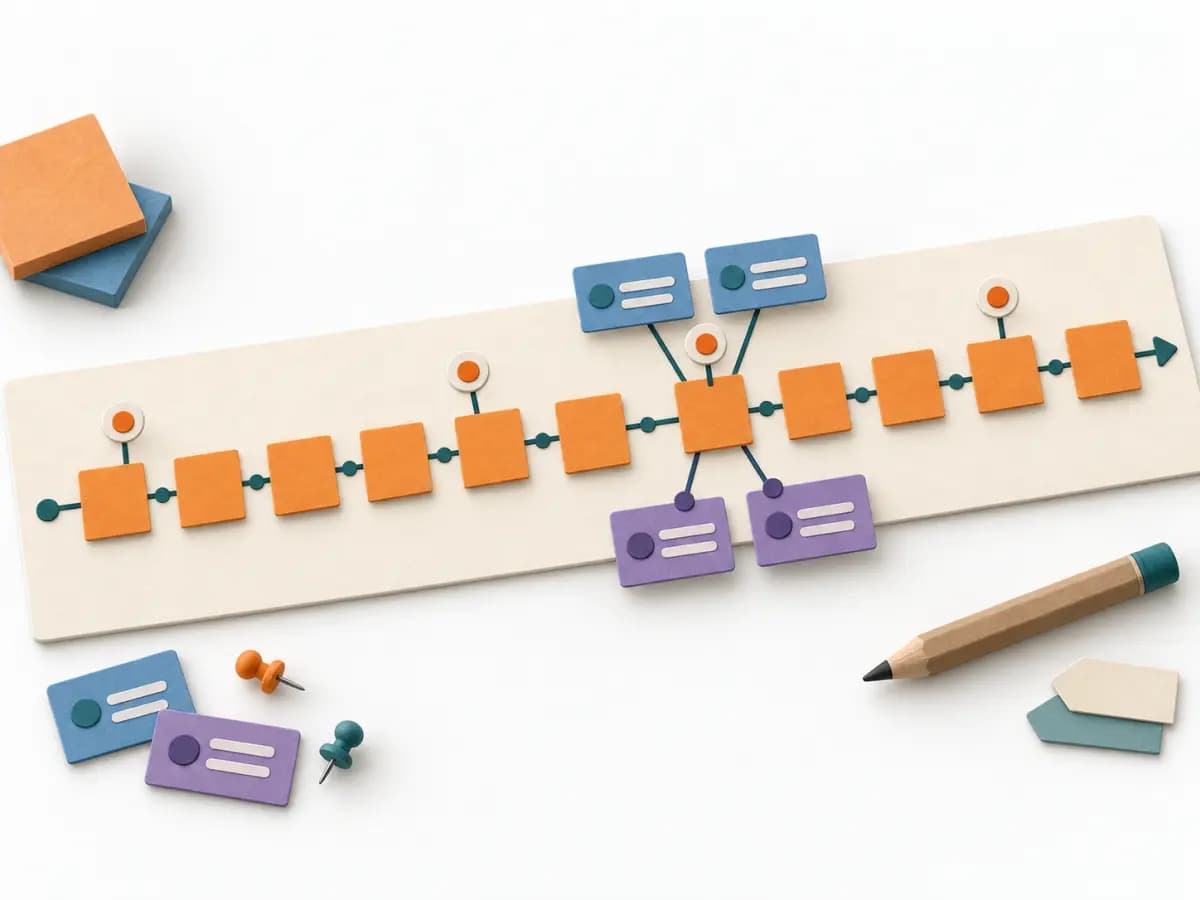
Purposedifferent | Event Modeling connects business workflows with commands, events, and views into one coherent mental model. It helps design behavior, UI, and technical slices from the same underlying logic. | When a topic gets stuck too quickly in the same thinking mode, Six Thinking Hats deliberately separates the perspectives. This means facts, risks, creativity, and emotional signals get worked through one after another instead of mixed together. | When an initiative stalls, the limit often lies not in the idea but in hard or soft boundary conditions. Constraint Analysis separates these limits and shows which of them can actually be shaped. |
Complexitydifferent | Medium | Medium | Low |
Timedifferent | 2-6 h | 45-90 min | 30-90 min |
Participantsdifferent | 2-8 | 4-12 | 2-8 |
Formatdifferent | Workshop + async | Workshop | Workshop + async |
Outputdifferent | Event Model, UI Flow, Commands, Read Models | Perspective Notes, Decision Inputs, Action Items | Constraint List, Hard/Soft Classification, Option Impact Notes, Decision Boundaries |
Tagsno overlap | EventsBlueprintDomain-Driven DesignBehavior | FacilitationOptionsDecision | ConstraintsDecisionPlanningOptions |
Often compared together
Methods with strong topical overlap with the current selection, not yet in the comparison.