View methods side by side.
Choose up to four methods. Add them using the search and share the comparison by copying its link.
| Criterion |  UX Research Empathy Mapping | 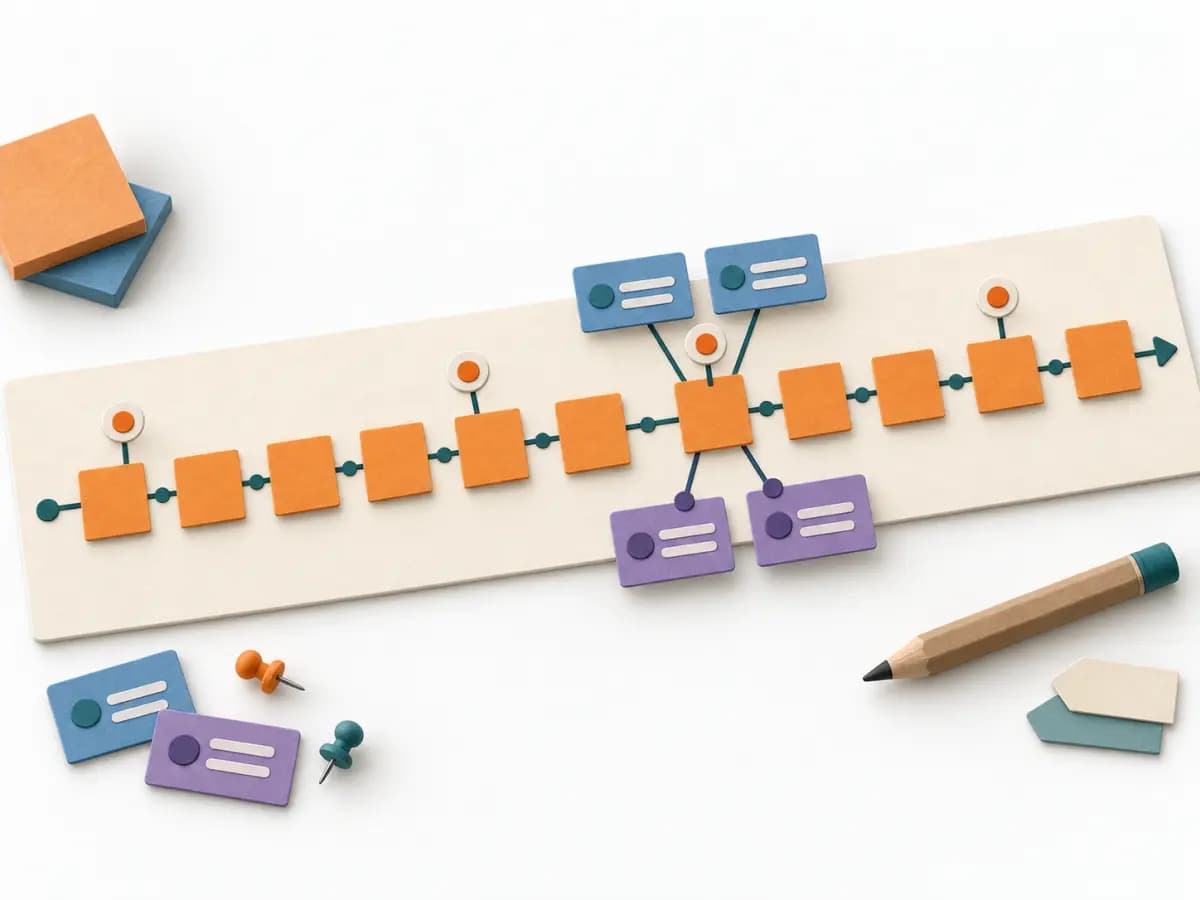 Domain Modeling EventStorming | 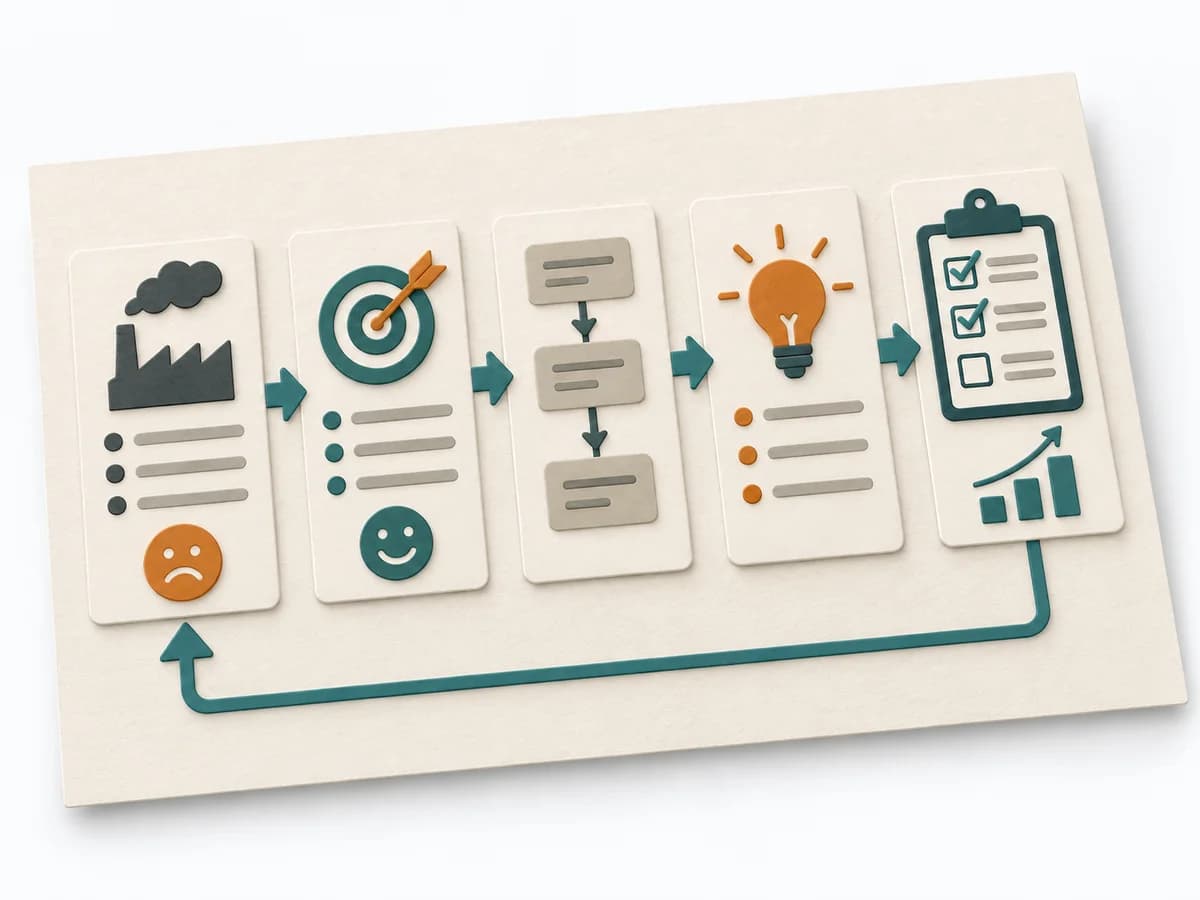 Operations A3 Problem Solving |
|---|---|---|---|
Purposedifferent | When a lot is assumed about a target group but little is seen jointly, empathy mapping makes knowledge and gaps directly comparable. The picture also shows which assumptions hold up and where evidence is missing. | When a domain consists of many events, rules, and states, it creates a shared modeling space for the team. It bundles language, flows, and boundaries before domain knowledge fragments into siloed views. | For a complex deviation with several people involved, the method bundles problem, analysis, and decision onto one page. It creates a shared working space where causes, countermeasures, and follow-up fit together. |
Complexitydifferent | Low | Medium | Medium |
Timedifferent | 30–60 min | 2-8 h | 45-90 min |
Participantsdifferent | 4-8 | 5-12 | 2-5 |
Formatdifferent | Workshop | Workshop | Workshop + async |
Outputdifferent | Empathy Map, Assumptions List, Research Gaps | Event Timeline, Ubiquitous Language, Boundaries, Open Questions | A3 Report, Action Plan, Root Cause Analysis |
Tagsno overlap | SynthesisQualitativeWorkshop | Domain-Driven DesignEventsDiscoveryWorkshop | LeanProblem solvingCoachingOperations |
Often compared together
Methods with strong topical overlap with the current selection, not yet in the comparison.