View methods side by side.
Choose up to four methods. Add them using the search and share the comparison by copying its link.
| Criterion |  UX Research Empathy Mapping | 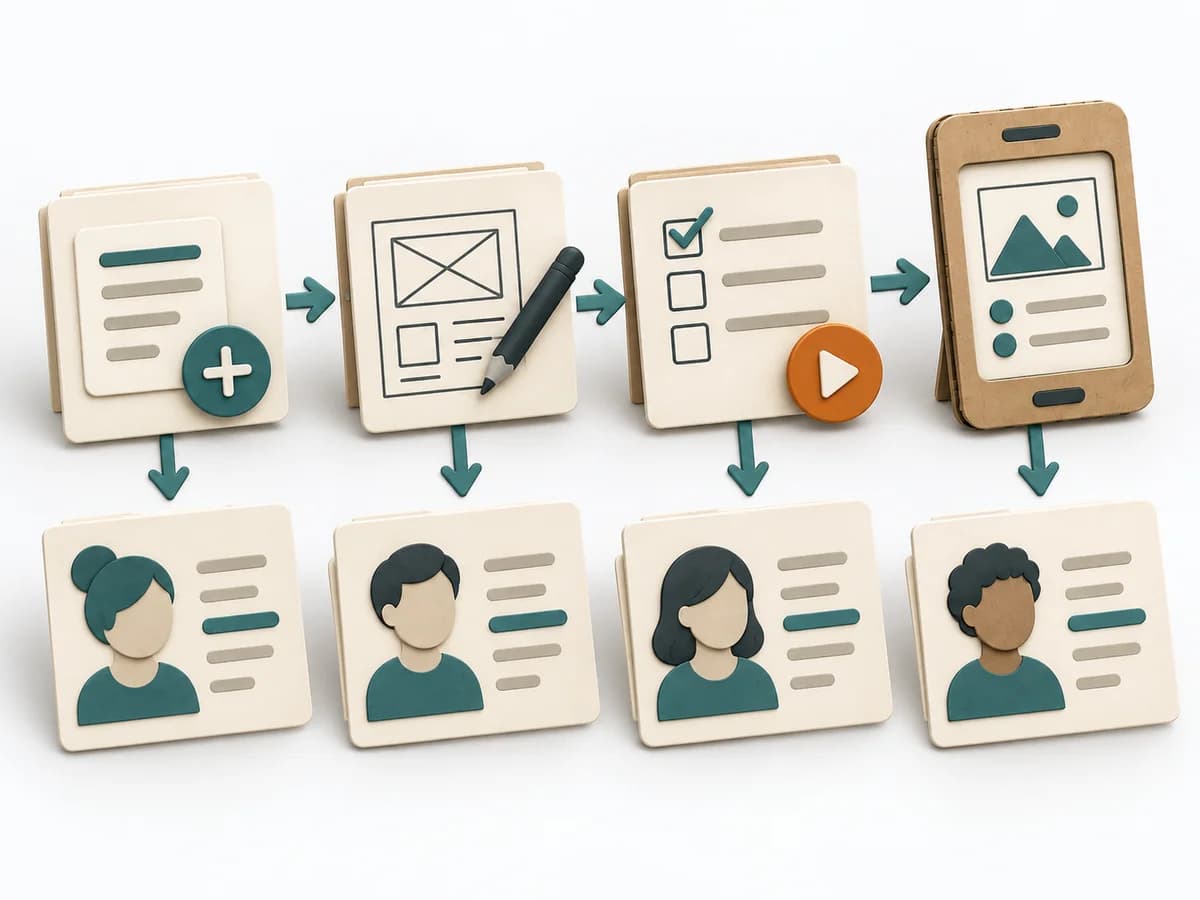 Knowledge Modeling Event Modeling |  UX Research Customer Journey Mapping |
|---|---|---|---|
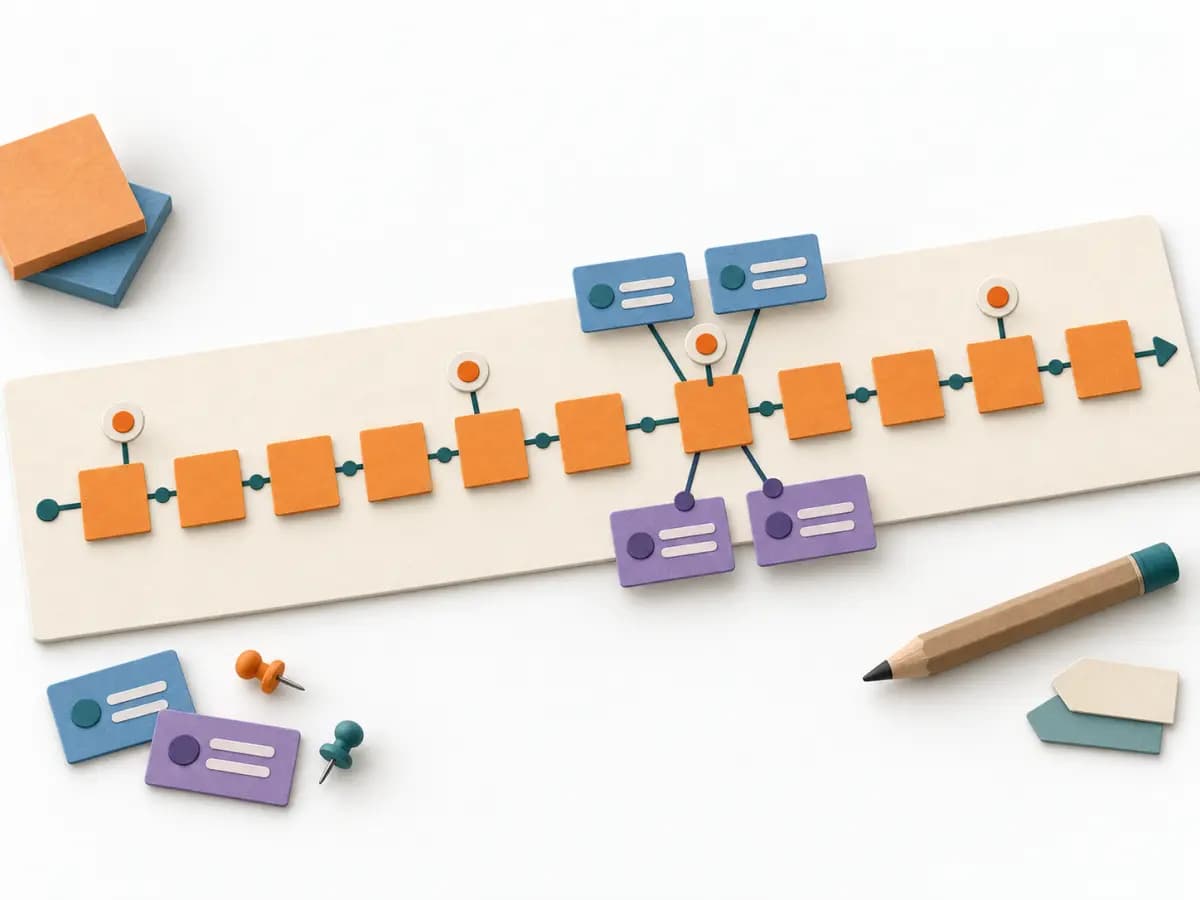
Purposedifferent | When a lot is assumed about a target group but little is seen jointly, empathy mapping makes knowledge and gaps directly comparable. The picture also shows which assumptions hold up and where evidence is missing. | Event Modeling connects business workflows with commands, events, and views into one coherent mental model. It helps design behavior, UI, and technical slices from the same underlying logic. | When a user journey falls apart across many touchpoints, customer journey mapping makes the experience visible as a coherent arc. Phases, emotions, and breaks become legible enough to prioritize critical moments deliberately. |
Complexitydifferent | Low | Medium | Medium |
Timedifferent | 30–60 min | 2-6 h | 2-4 h |
Participantsdifferent | 4-8 | 2-8 | 4-10 |
Formatdifferent | Workshop | Workshop + async | Workshop |
Outputdifferent | Empathy Map, Assumptions List, Research Gaps | Event Model, UI Flow, Commands, Read Models | Journey Map, Pain-point List, Opportunity Backlog |
Tagsno overlap | SynthesisQualitativeWorkshop | EventsBlueprintDomain-Driven DesignBehavior | JourneyServiceService design |
Often compared together
Methods with strong topical overlap with the current selection, not yet in the comparison.