View methods side by side.
Choose up to four methods. Add them using the search and share the comparison by copying its link.
| Criterion |  UX Research Empathy Mapping | 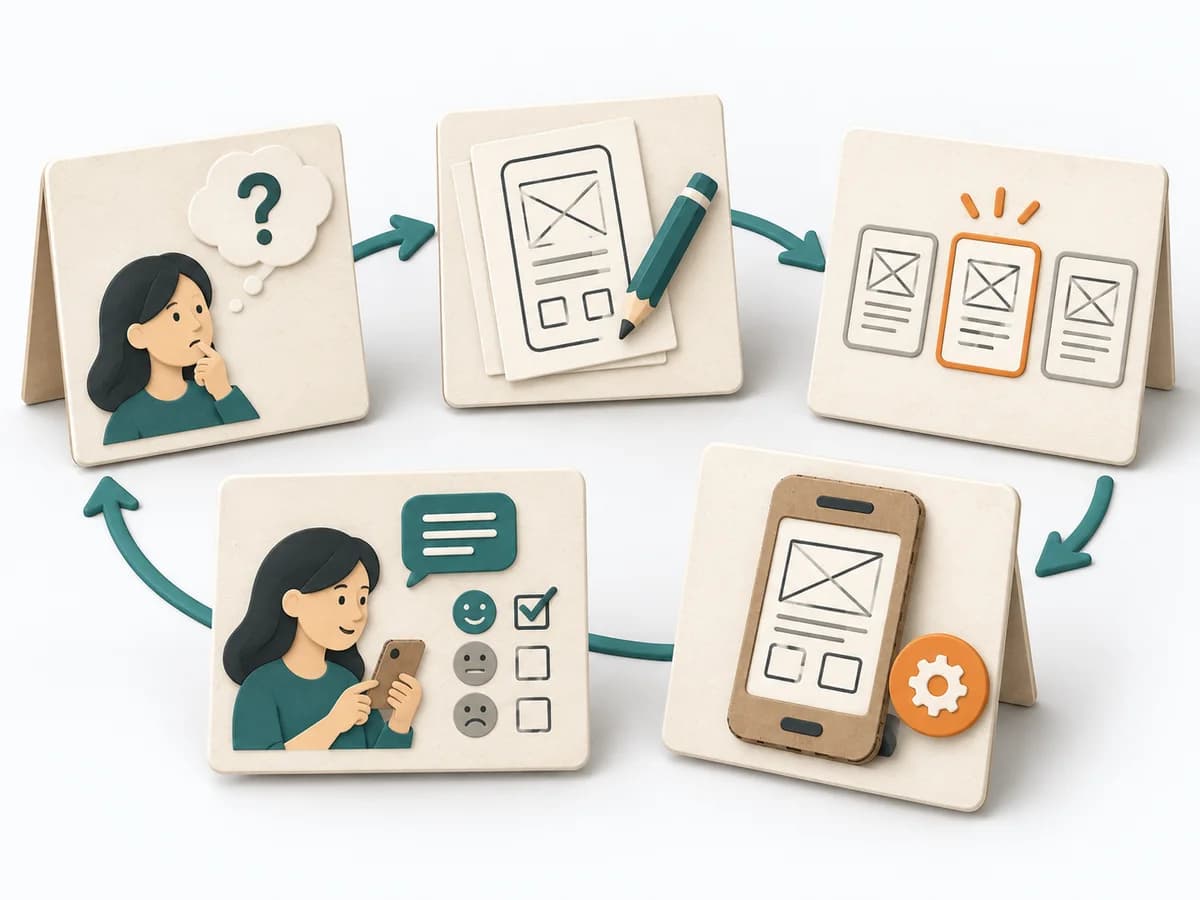 Innovation Design Sprint | 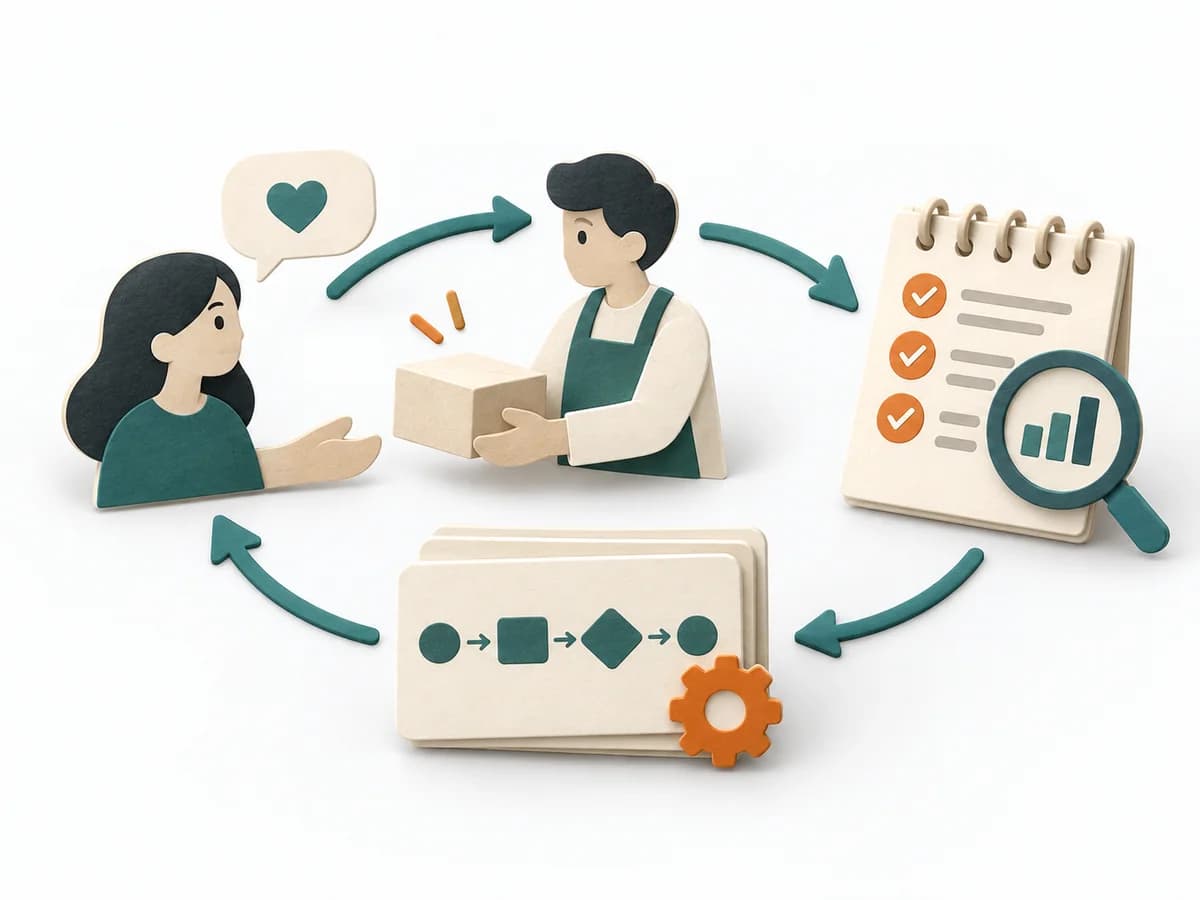 Product Discovery Concierge MVP |
|---|---|---|---|
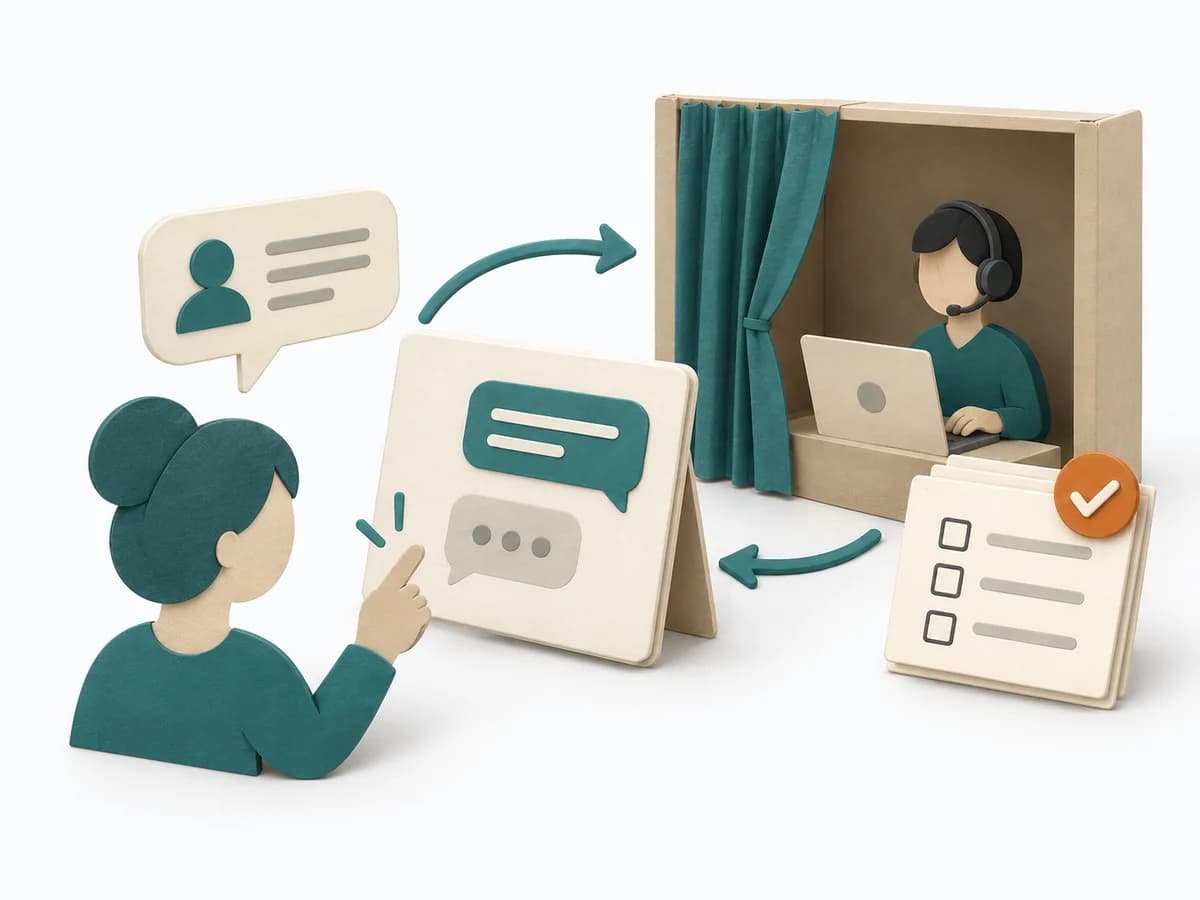
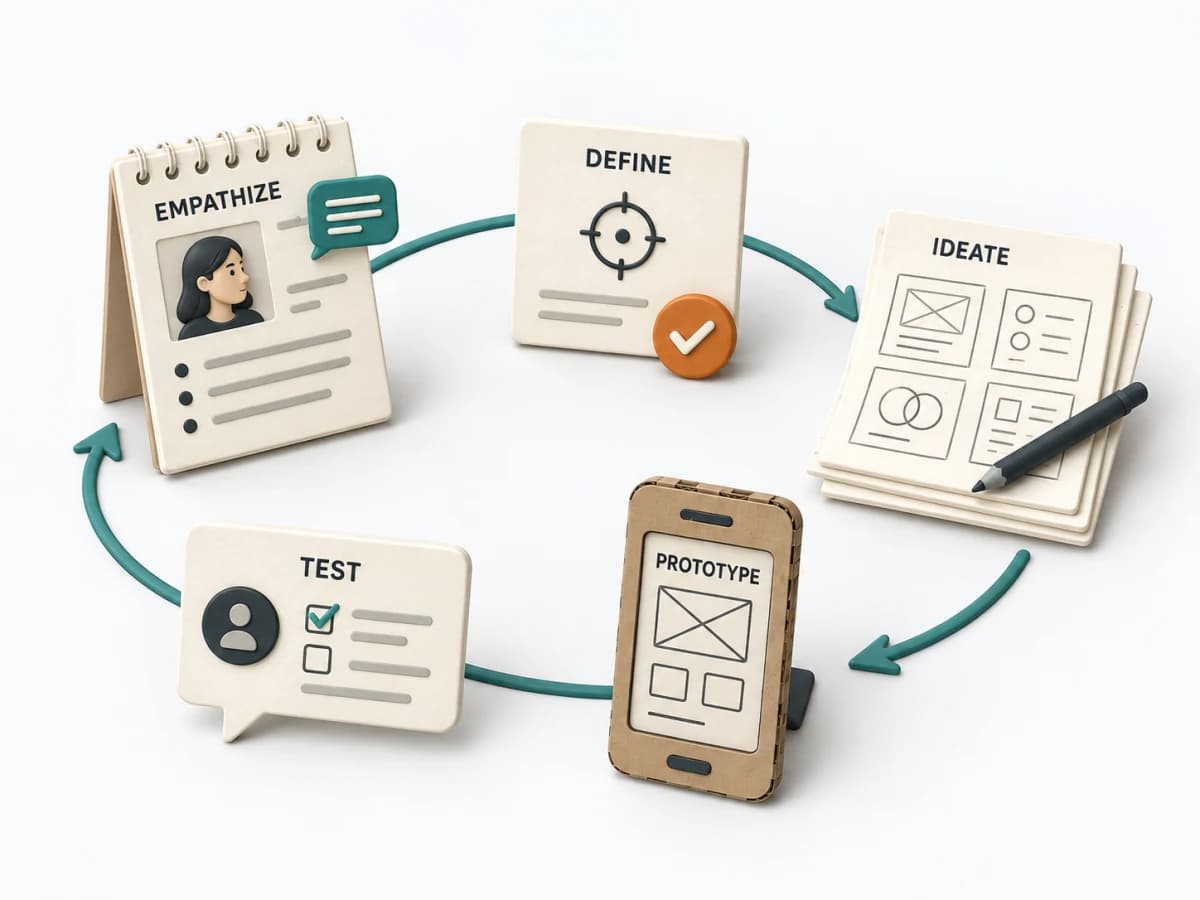
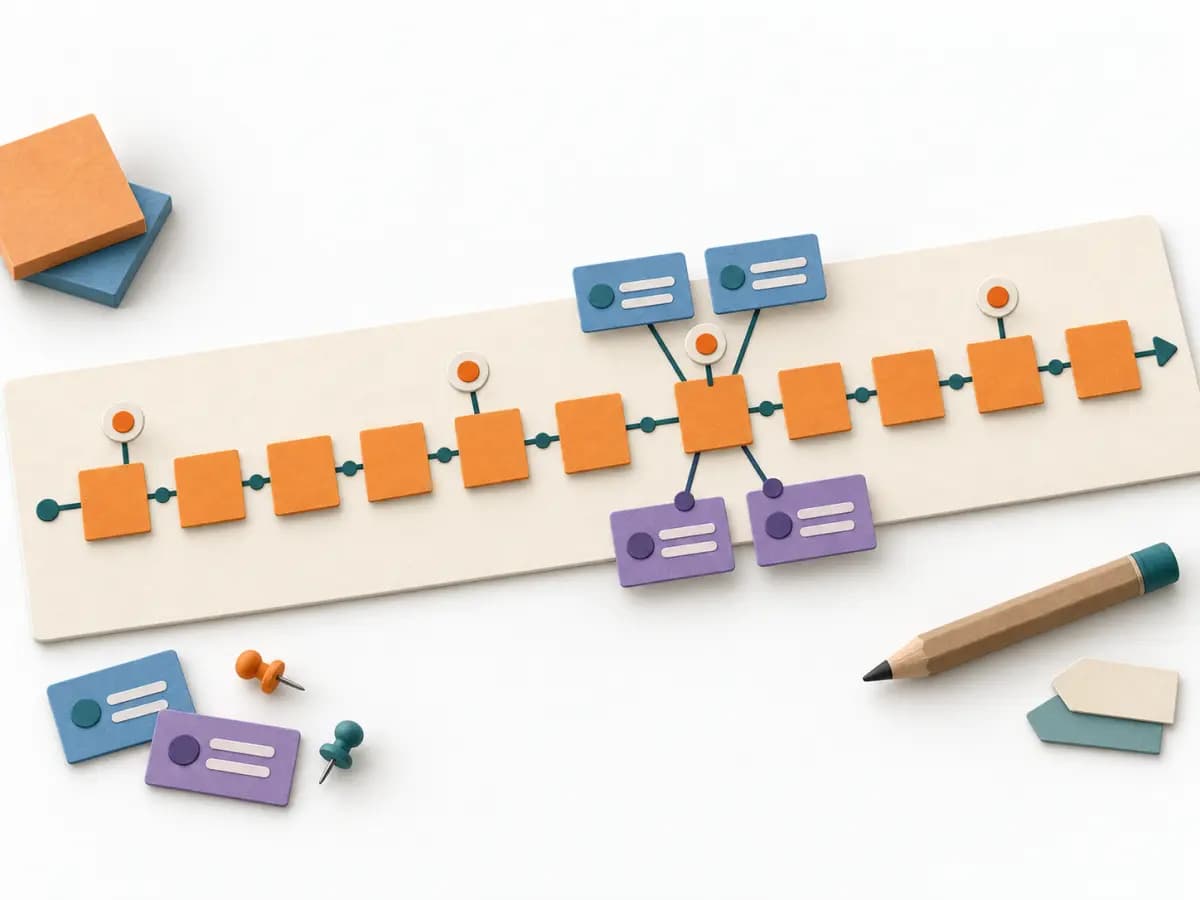
Purposedifferent | When a lot is assumed about a target group but little is seen jointly, empathy mapping makes knowledge and gaps directly comparable. The picture also shows which assumptions hold up and where evidence is missing. | When the product question is unclear and time pressure is high, the method takes a team from an open idea to a testable solution. It connects problem understanding, decision, and learning in one compact format, lowering the risk of spending a lot of energy on a mere guess. | When an idea can first fail or grow through genuine hands-on support, it relies on manual work instead of automation. It shows whether user value holds up even under manual execution. |
Complexitydifferent | Low | High | Medium |
Timedifferent | 30–60 min | 4-5 Tage | 1-4 Wochen |
Participantsdifferent | 4-8 | 5-8 | 3-10 Kunden |
Formatdifferent | Workshop | Workshop | Workshop + async |
Outputdifferent | Empathy Map, Assumptions List, Research Gaps | Prototype, Test Findings, Decision Rationale | Concierge Learnings, Service Blueprint, MVP Risks |
Tagsno overlap | SynthesisQualitativeWorkshop | Design sprintPrototypeValidationInnovation | MVPValidationServiceDiscovery |
Often compared together
Methods with strong topical overlap with the current selection, not yet in the comparison.