View methods side by side.
Choose up to four methods. Add them using the search and share the comparison by copying its link.
| Criterion | 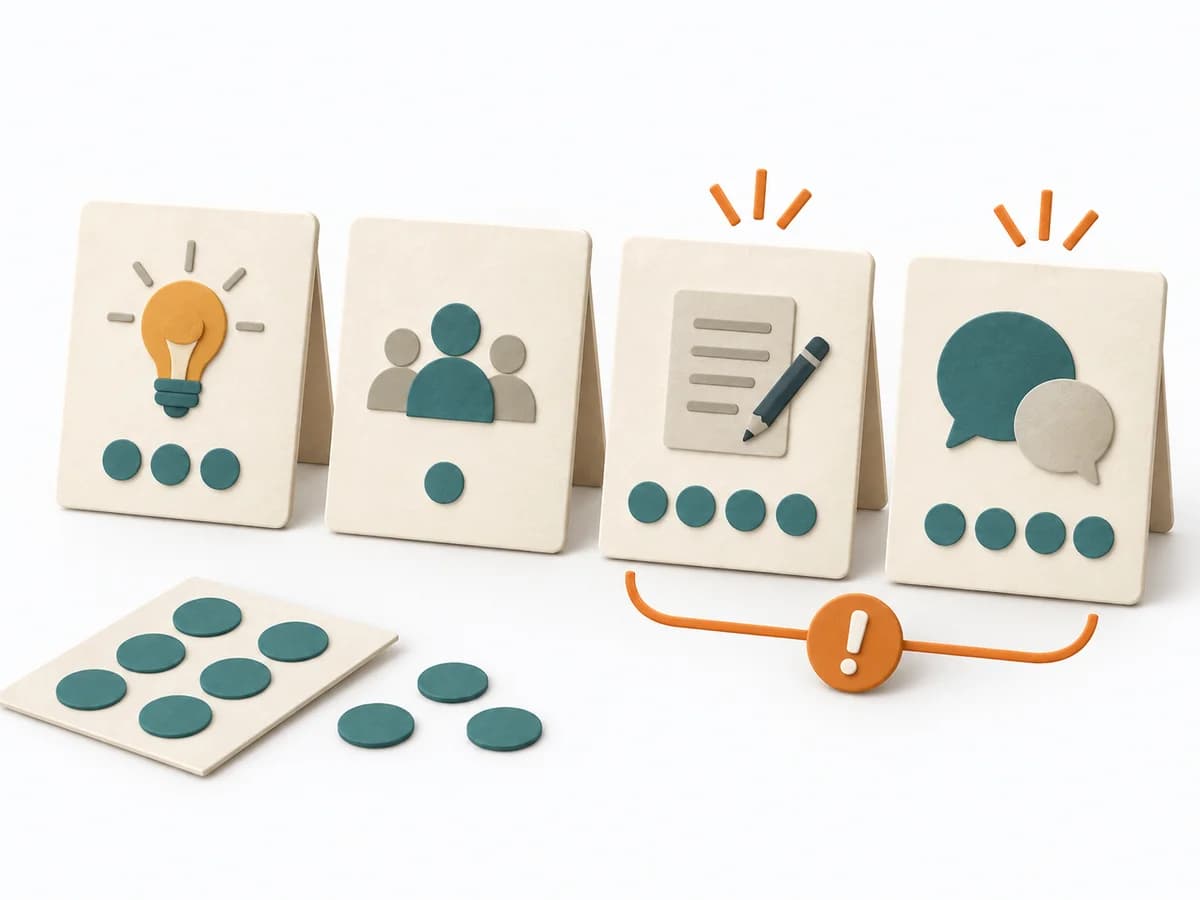 Facilitation Dot Voting |  Delivery Value Stream Mapping | 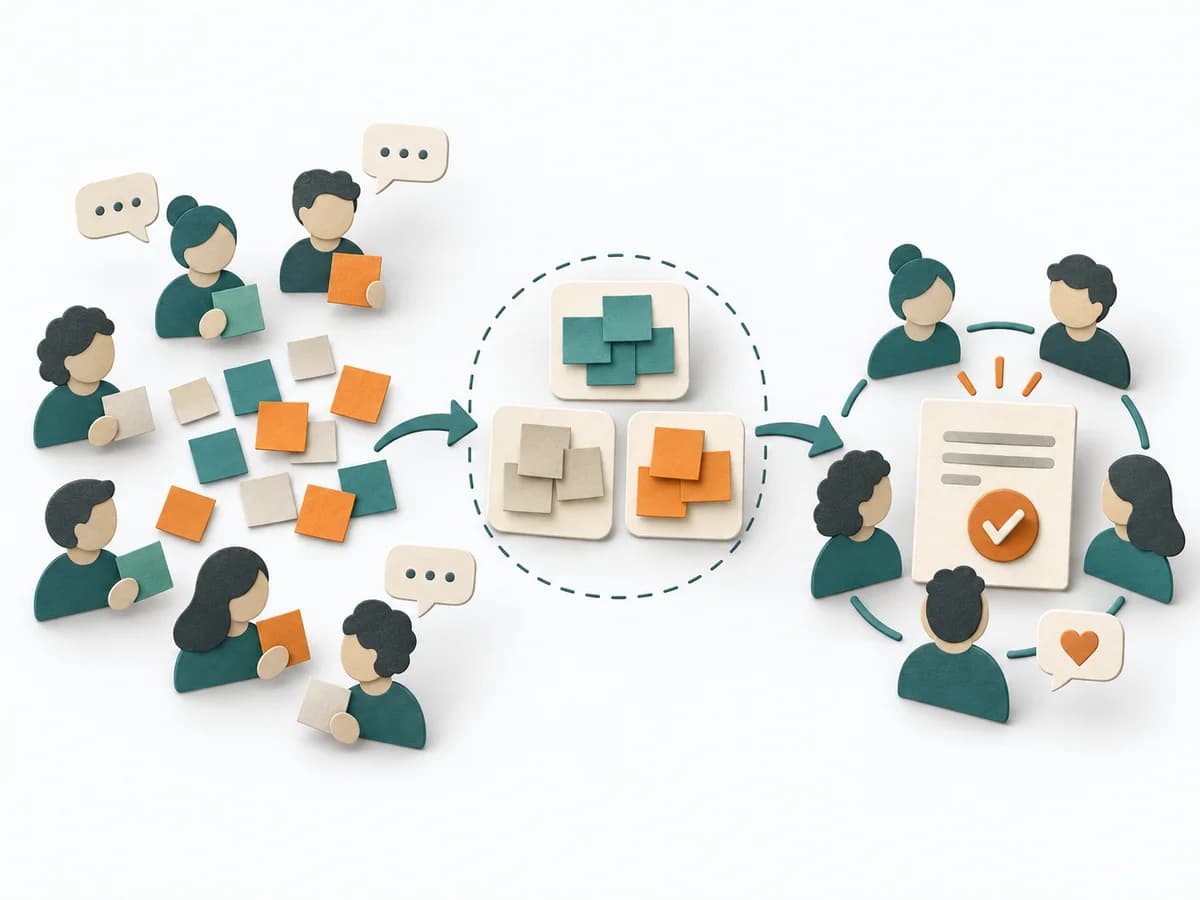 Facilitation Consensus Workshop |
|---|---|---|---|
Purposedifferent | When a workshop has produced too many options and the group needs to condense quickly, dot voting makes preferences visible in a short time. It bundles individual votes into a solid signal for the next selection. | When delivery work dissolves into wait times, handoffs, and hidden effort, Value Stream Mapping makes the actual flow visible. The method exposes bottlenecks, idle time, and feedback loops so lead time and improvement levers become tangible. | When a group needs a solid decision without outvoting individual factions, a Consensus Workshop creates a negotiable common ground. It makes agreement, reservations, and open tensions discussable at the same time. |
Complexitydifferent | Low | Medium | Medium |
Timedifferent | 5-15 min | 1-3 h | 1-3 h |
Participantsdifferent | 3-20 | 4-10 | 5-30 |
Formatsame | Workshop | Workshop | Workshop |
Outputdifferent | Ranked list, Consensus signal, Shortlist | Current-state map, Future-state map, Bottleneck list | Consensus Clusters, Theme Titles, Priority Areas |
Tagsno overlap | FacilitationVotingConsensusPrioritization | LeanFlowWasteDelivery | FacilitationConsensusWorkshopAlignment |
Often compared together
Methods with strong topical overlap with the current selection, not yet in the comparison.