View methods side by side.
Choose up to four methods. Add them using the search and share the comparison by copying its link.
| Criterion |  UX Research Diary Study |  Growth Flywheel | 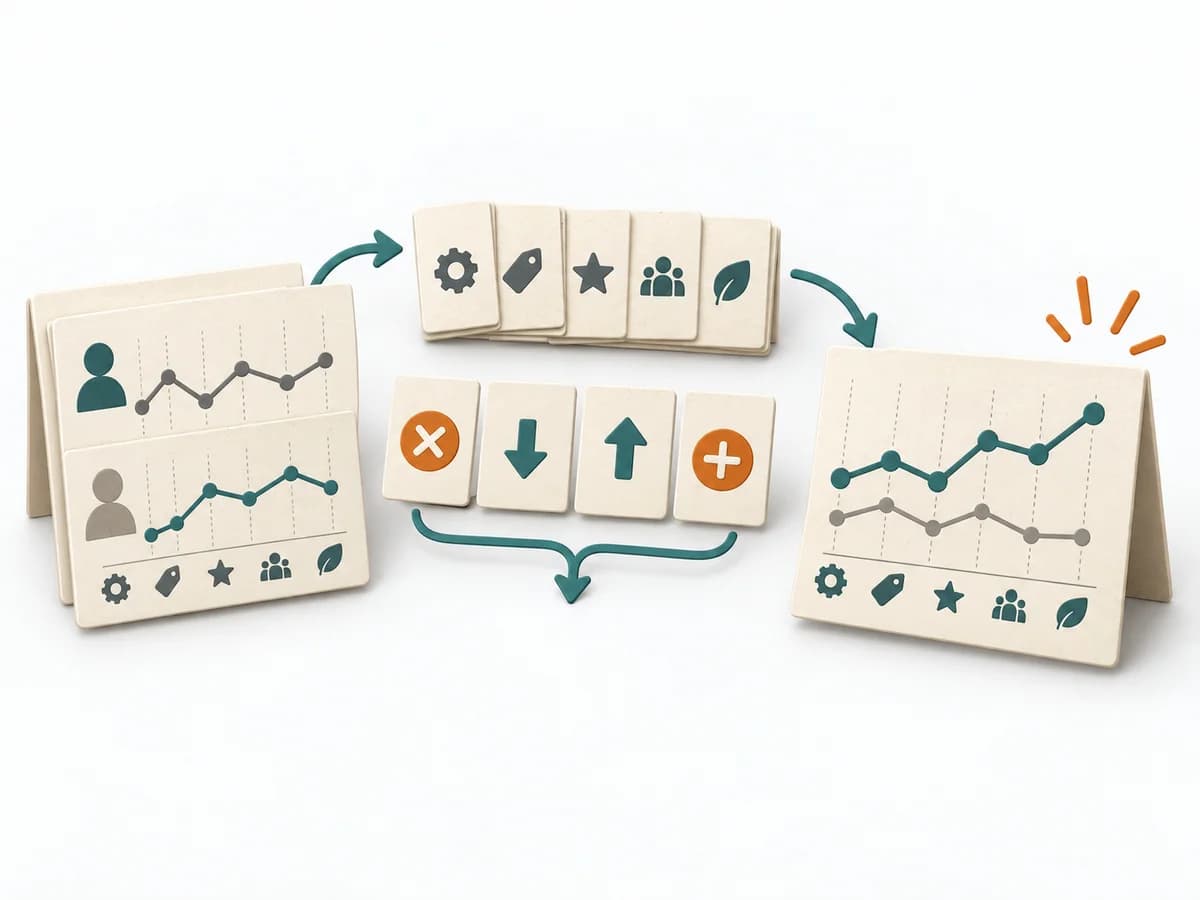 Business Strategy Blue Ocean Strategy Canvas |
|---|---|---|---|
Purposedifferent | When experiences build up over days or weeks and a single session cannot capture them, Diary Study records the course of everyday life. Recurring triggers, moods, and habits become visible this way, beyond the sharpness of memory. | Growth often breaks down where a reinforcing mechanism builds up too much friction. A Flywheel shows the cycle of value, repetition, and reinforcement meant to sustain growth. | The Blue Ocean Strategy Canvas shows how an offering is positioned relative to the market. Differentiation thereby becomes tangible in value factors instead of merely being claimed. |
Complexitysame | Medium | Medium | Medium |
Timedifferent | 1-4 Wochen | 60-120 min | 2-4 h |
Participantsdifferent | 5-20 | 3-8 | 3-10 |
Formatdifferent | Async | Workshop | Workshop |
Outputdifferent | Diary Entries, Longitudinal Patterns, Experience Timeline | Flywheel Map, Friction Points, Growth Levers, Experiment Backlog | Strategy Canvas, Value Curve, ERRC Actions |
Tagsno overlap | UX researchTrackingBehavior | GrowthRetentionConversion | StrategyPositioningInnovationValue |
Often compared together
Methods with strong topical overlap with the current selection, not yet in the comparison.