View methods side by side.
Choose up to four methods. Add them using the search and share the comparison by copying its link.
| Criterion |  Innovation Design Sprint |  Business Strategy Balanced Scorecard |  Architecture ARID (Active Reviews for Intermediate Designs) |
|---|---|---|---|
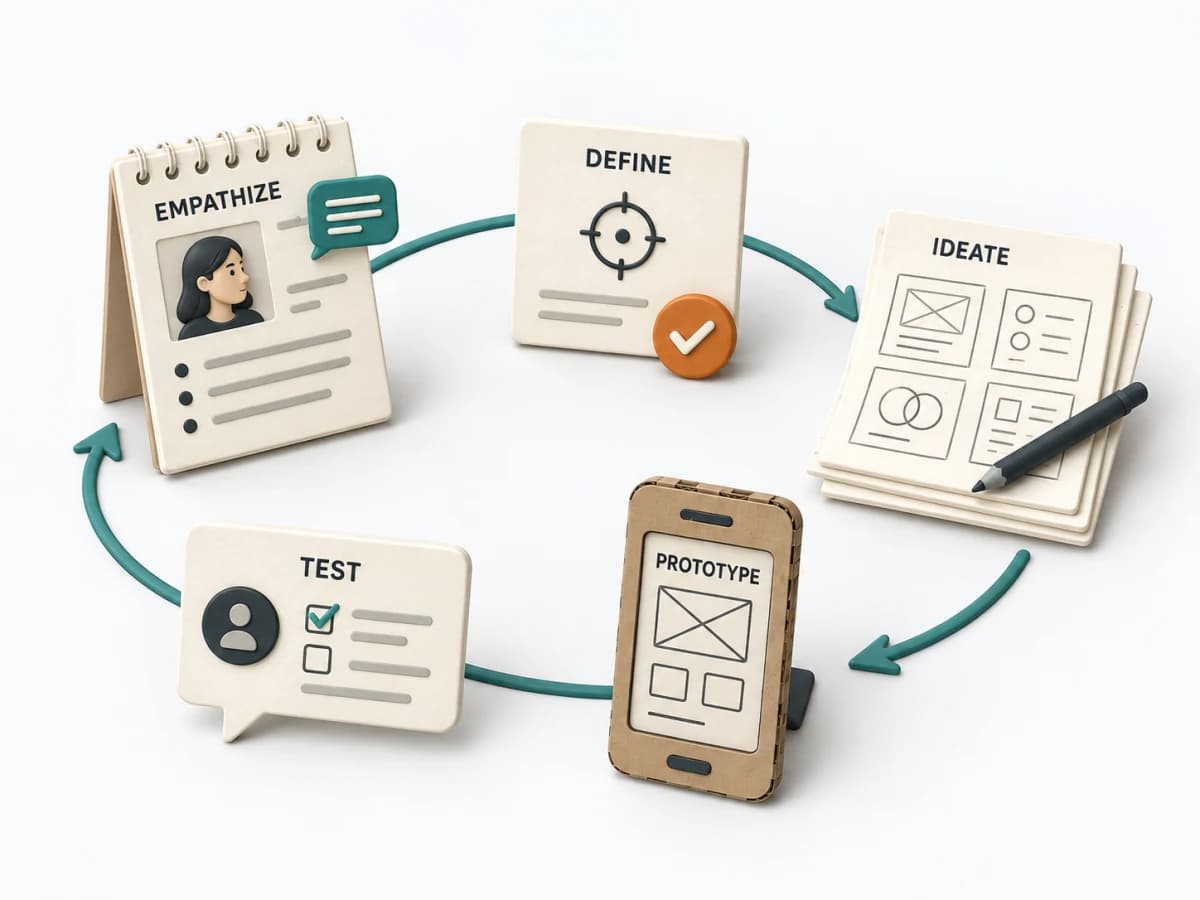
Purposedifferent | When the product question is unclear and time pressure is high, the method takes a team from an open idea to a testable solution. It connects problem understanding, decision, and learning in one compact format, lowering the risk of spending a lot of energy on a mere guess. | Balanced Scorecard translates strategy into a few interconnected perspectives and metrics. It holds impact, steering, and learning together in daily work instead of narrowing strategy down to financial figures. | ARID examines how well developers can work with a technical design. It focuses on a part of the system that can still be revised, between the architecture overview and the detailed specification. |
Complexitydifferent | High | High | Medium |
Timedifferent | 4-5 Tage | Halber Tag bis mehrere Wochen | 2–4 h review as a planning range; preparation and evaluation additional |
Participantsdifferent | 5-8 | 4-12 | Designers, developers as users, and facilitation |
Formatdifferent | Workshop | Workshop + async | Workshop + async |
Outputdifferent | Prototype, Test Findings, Decision Rationale | Balanced Scorecard, Strategic Measures, Initiative Map | Prioritized development tasks, Jointly produced code or pseudocode, Observed difficulties and open design questions, Proposed design revisions |
Tagsno overlap | Design sprintPrototypeValidationInnovation | StrategyMetricsExecution | ArchitectureEngineeringFeedbackValidationTasks |
Often compared together
Methods with strong topical overlap with the current selection, not yet in the comparison.