View methods side by side.
Choose up to four methods. Add them using the search and share the comparison by copying its link.
| Criterion |  Delivery Cost of Delay |  UX Research First-click Testing | 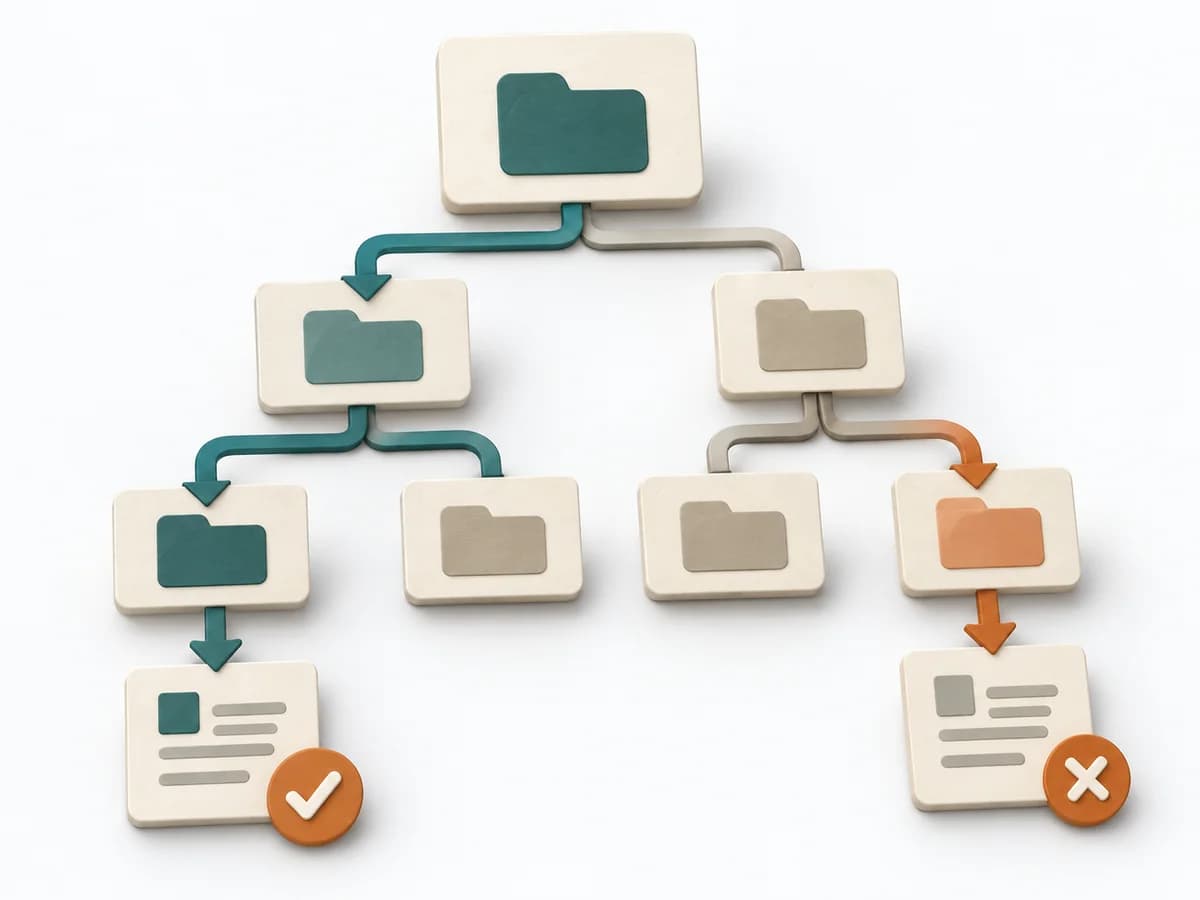 UX Research Tree Testing |
|---|---|---|---|
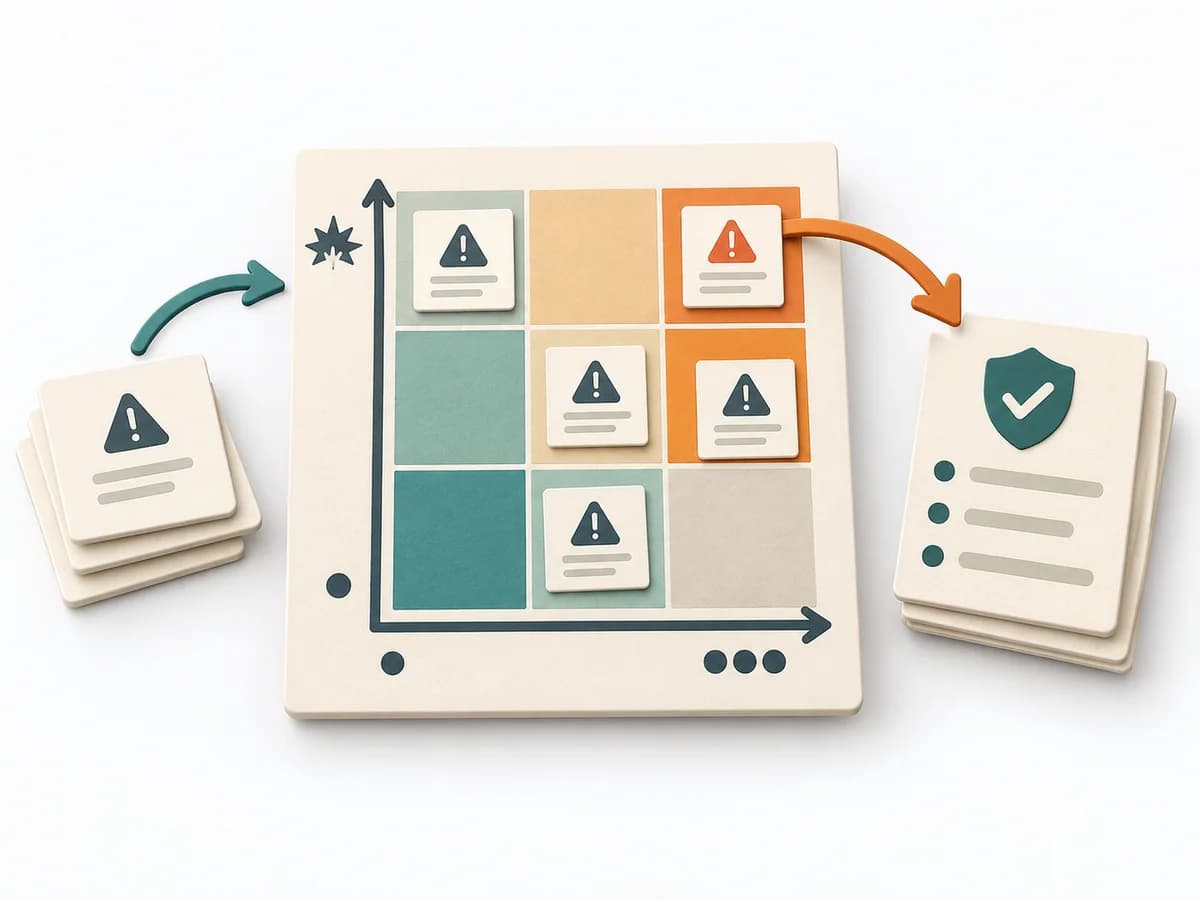
Purposedifferent | Helps clarify scope, order, and delivery flow in concrete terms. It makes work, constraints, and sequence manageable. The result is captured as a Cost of Delay table and prioritization sequence. | When users immediately turn the wrong way on a screen or wireframe, first click testing checks initial orientation at high speed. The first click shows early whether expectation, labeling, and wayfinding fit together. | When a navigation exists but search paths still fail, tree testing checks findability without visual distraction. The method shows whether labels, levels, and paths really lead to the intended destination. |
Complexitydifferent | High | Low | Medium |
Timedifferent | 90-180 min | 1-2 Tage | 1-2 Tage |
Participantsdifferent | 3-8 | 10-30 | Based on research question |
Formatdifferent | Workshop | Async | Async |
Outputdifferent | CoD Table, Prioritization Sequence | Click Heatmap, Success Rate, Design Recommendations | Findability Metrics, Path Analysis, Revised IA |
Tagsno overlap | PrioritizationDeliveryEconomicsDecision | UXNavigationFindabilityValidation | Information architectureNavigationFindability |
Often compared together
Methods with strong topical overlap with the current selection, not yet in the comparison.