View methods side by side.
Choose up to four methods. Add them using the search and share the comparison by copying its link.
| Criterion |  Delivery Cost of Delay | 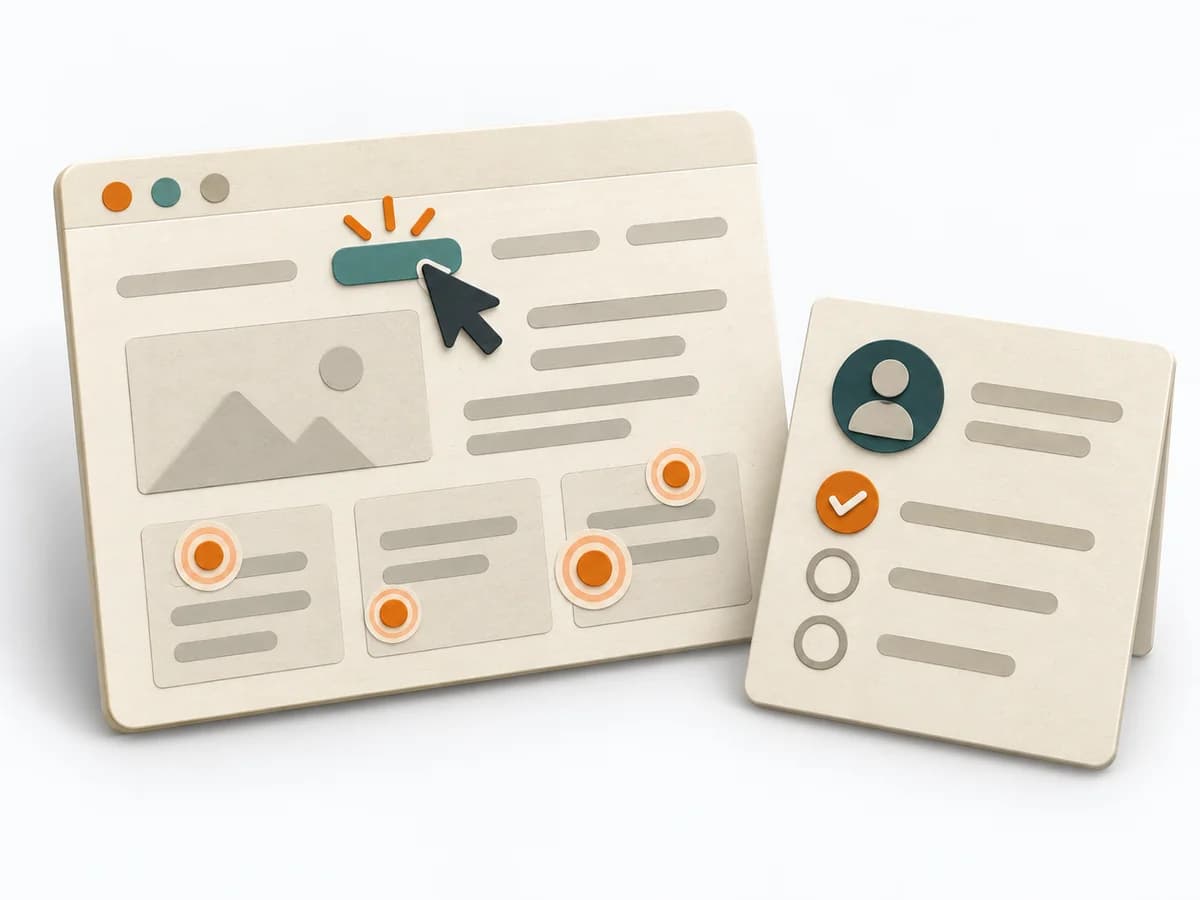 UX Research First-click Testing |  Product Strategy ICE Scoring |
|---|---|---|---|
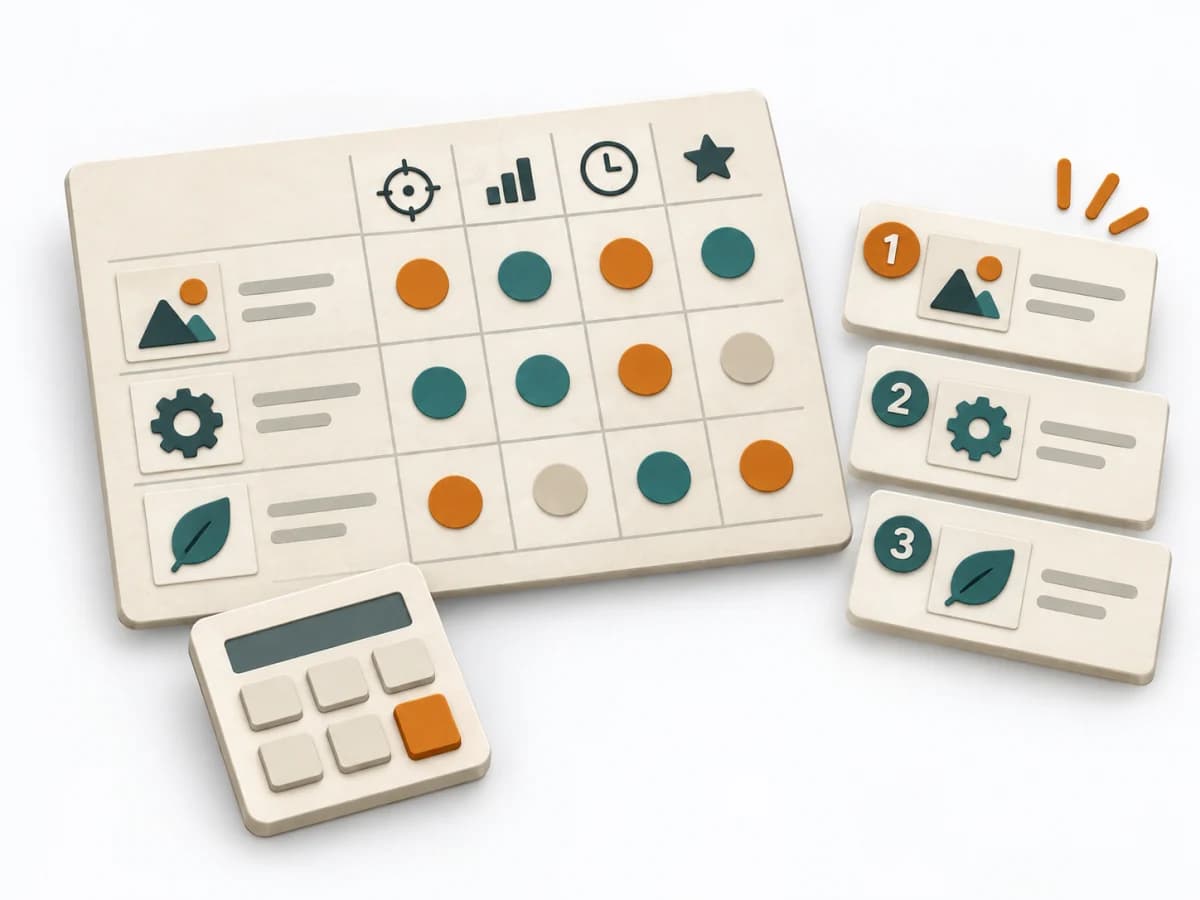
Purposedifferent | Helps clarify scope, order, and delivery flow in concrete terms. It makes work, constraints, and sequence manageable. The result is captured as a Cost of Delay table and prioritization sequence. | When users immediately turn the wrong way on a screen or wireframe, first click testing checks initial orientation at high speed. The first click shows early whether expectation, labeling, and wayfinding fit together. | When ideas need sorting quickly, it condenses impact, confidence, and effort into one compact score. It connects customer value, product logic, and decision priorities. The result is captured as an ICE table and top-ideas list. |
Complexitydifferent | High | Low | Low |
Timedifferent | 90-180 min | 1-2 Tage | 30-60 min |
Participantsdifferent | 3-8 | 10-30 | 2-8 |
Formatdifferent | Workshop | Async | Workshop + async |
Outputdifferent | CoD Table, Prioritization Sequence | Click Heatmap, Success Rate, Design Recommendations | ICE Table, Top Idea List |
Tagsno overlap | PrioritizationDeliveryEconomicsDecision | UXNavigationFindabilityValidation | PrioritizationScoringGrowthDecision |
Often compared together
Methods with strong topical overlap with the current selection, not yet in the comparison.