View methods side by side.
Choose up to four methods. Add them using the search and share the comparison by copying its link.
| Criterion | 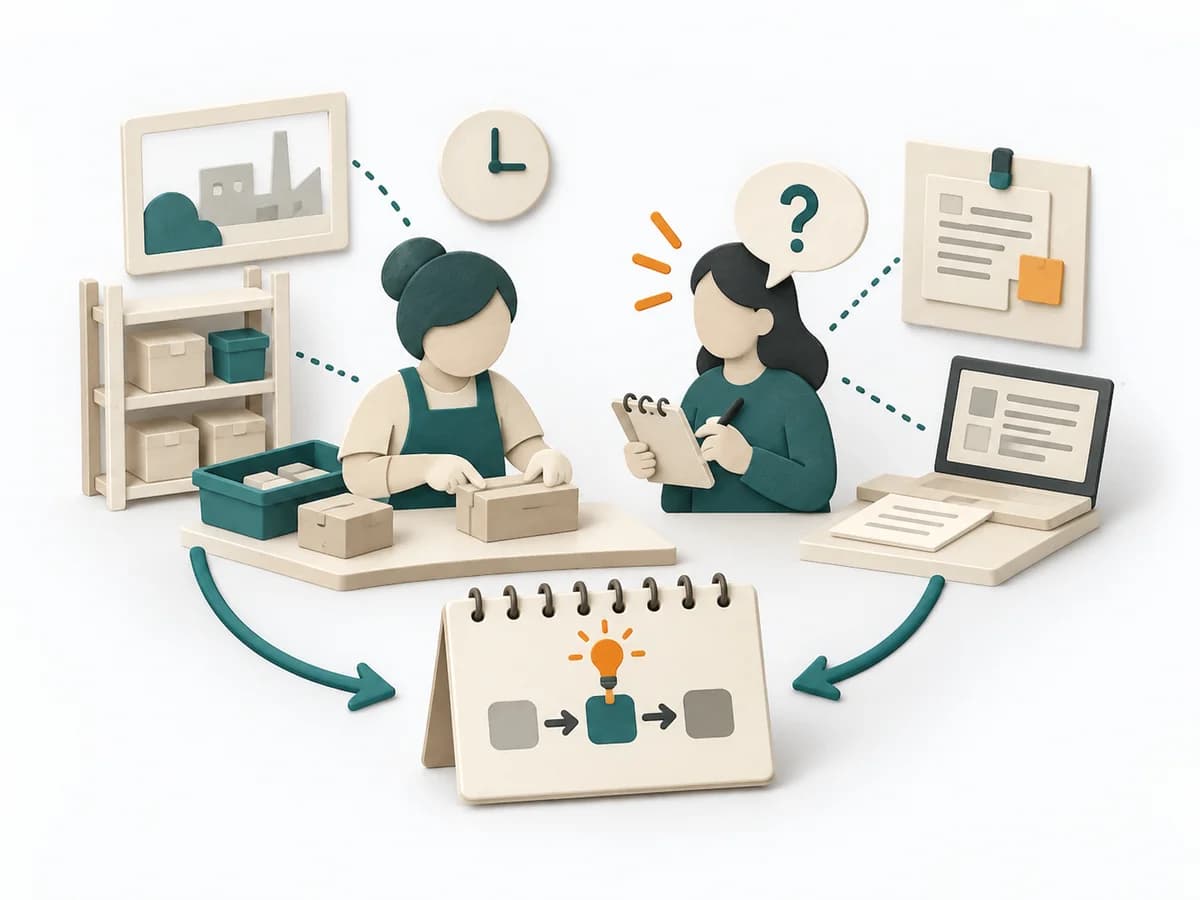 UX Research Contextual Inquiry | 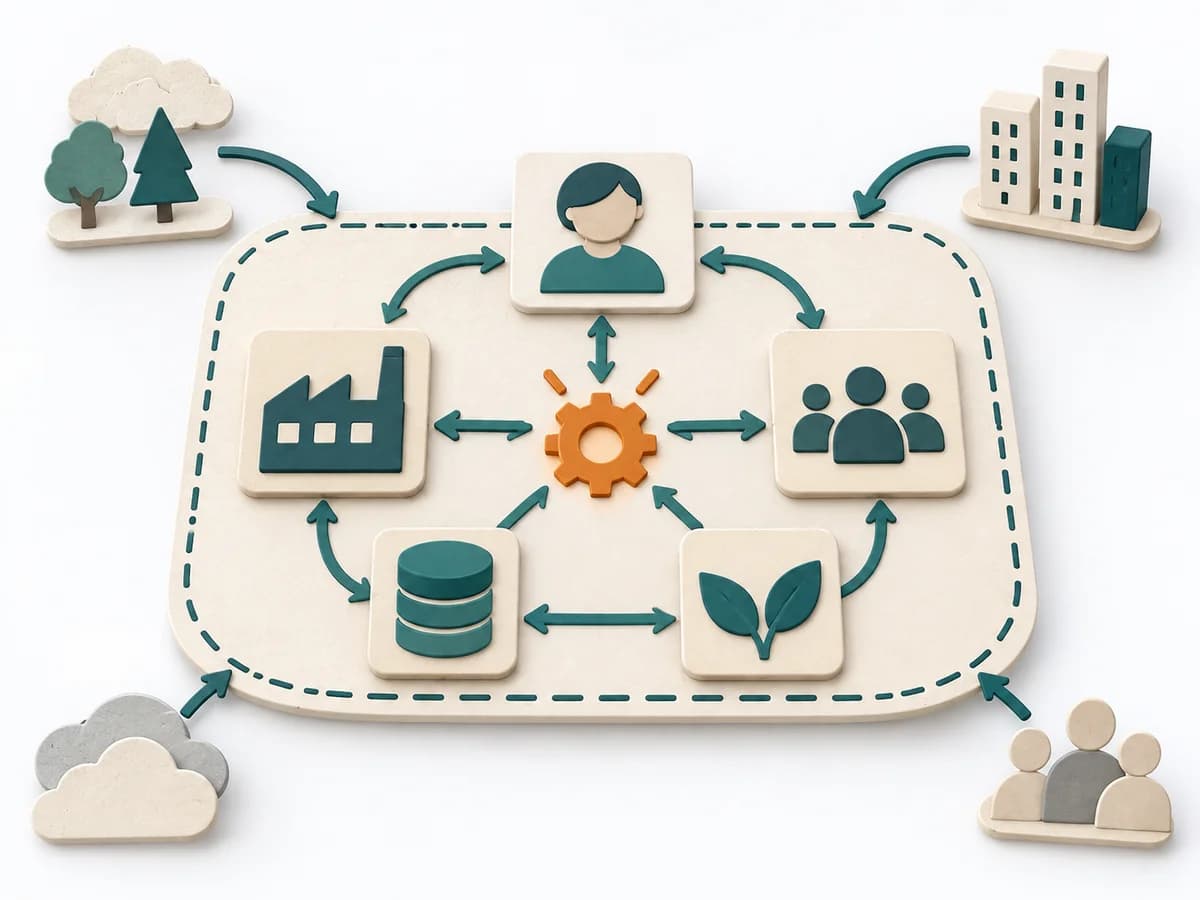 Systems Thinking Systems Mapping |  Systems Thinking Behavior Over Time Graph |
|---|---|---|---|
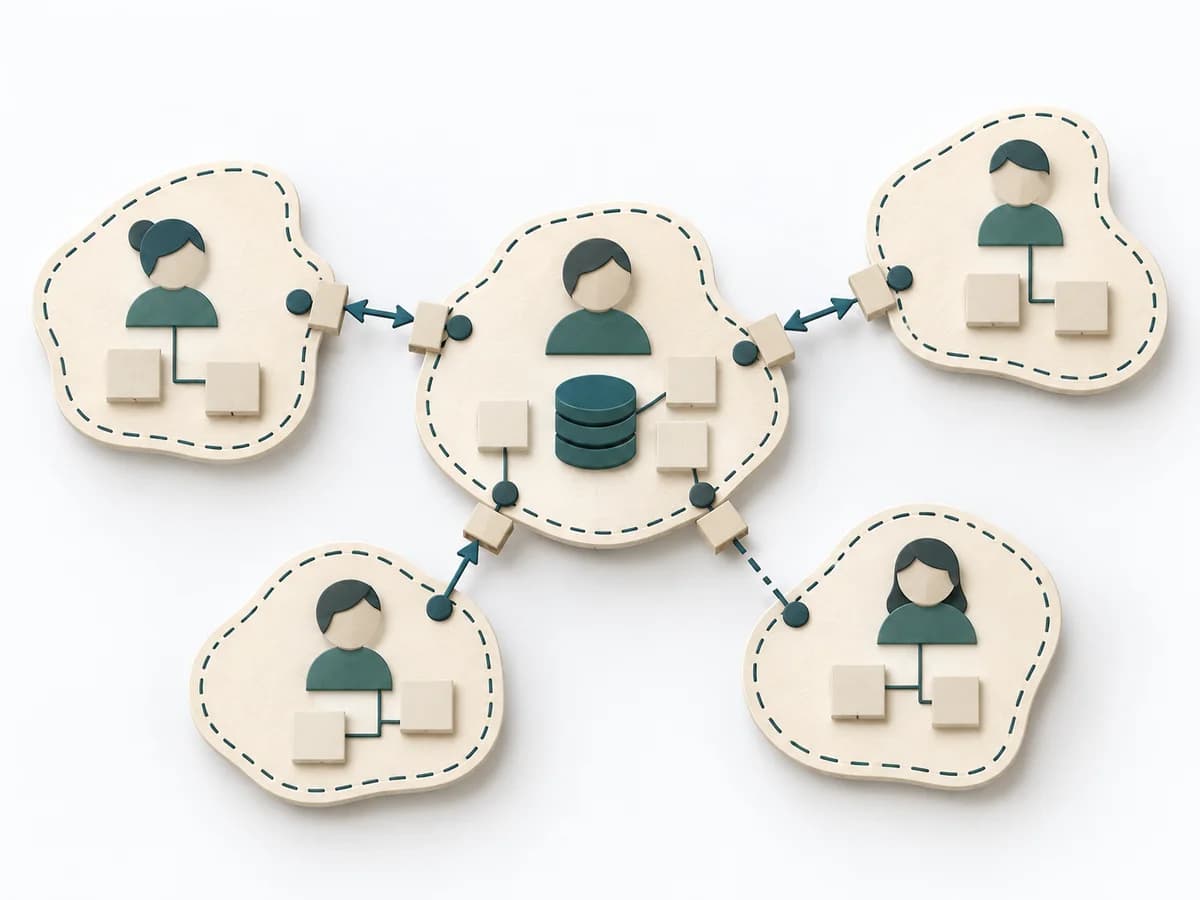
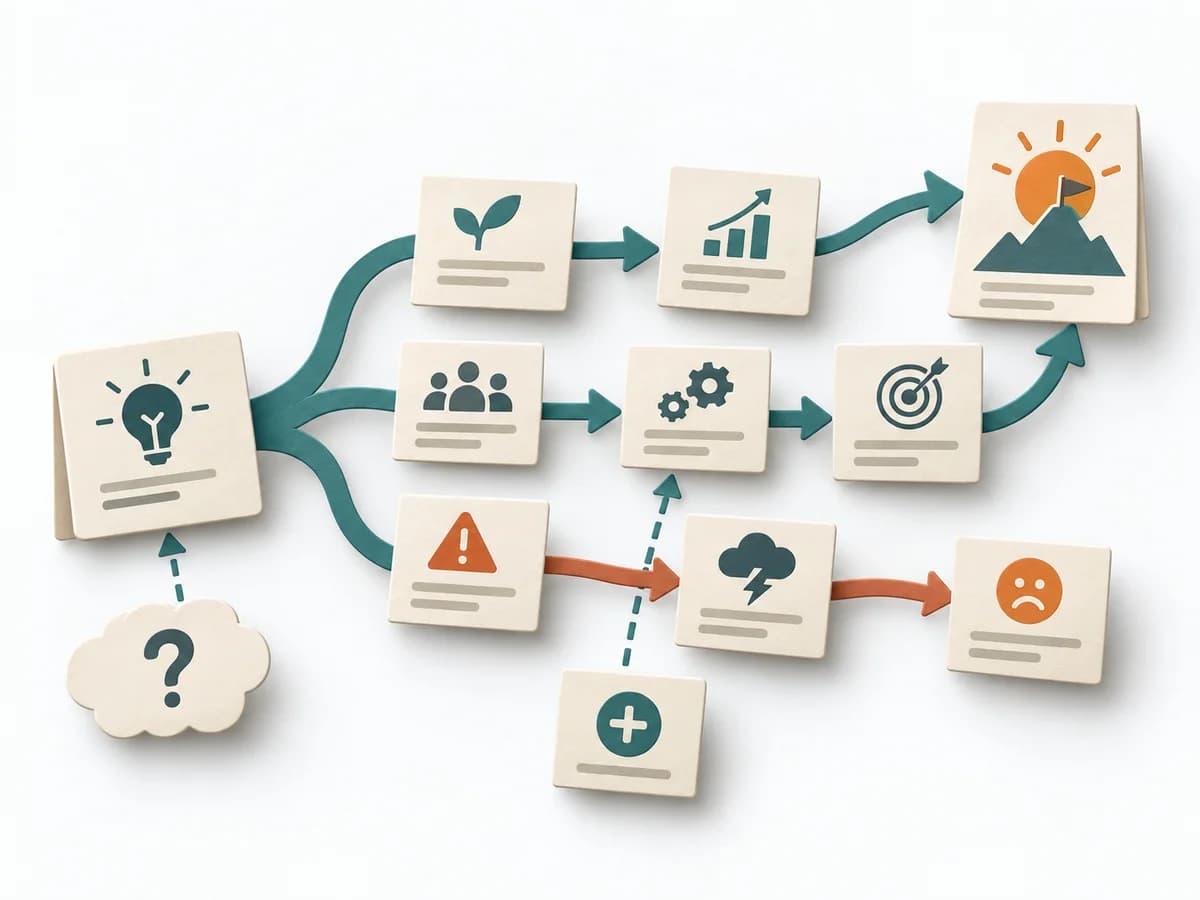
Purposedifferent | When work processes are known only from accounts and the real context stays hidden, Contextual Inquiry makes behavior at the workplace visible. Observation and follow-up questions together show how people actually work, get interrupted, and improvise. | Systems Mapping arranges elements, relationships, and boundaries so a complex field becomes legible at a glance. The overview stabilizes the overall picture before detail work or steering begins. | A Behavior Over Time Graph shows how a metric or observation develops over time. The method makes trends, breaks, and recurring patterns visible that get lost in snapshots. |
Complexitydifferent | Medium | Medium | Low |
Timedifferent | 1-3 Wochen | 1-3 h | 20-45 min |
Participantsdifferent | 4-12 Beobachtungen | 3-12 | 1-10 |
Formatsame | Workshop + async | Workshop + async | Workshop + async |
Outputdifferent | Field Notes, Workflow Insights, Pain Points | System Map, Dependencies, Leverage Points | Behavior Over Time Graph, Trend Hypotheses, Key Events |
Tagsno overlap | UX researchObservationContext | Systems thinkingMappingBoundariesChange | Systems thinkingPatternsDynamics |
Often compared together
Methods with strong topical overlap with the current selection, not yet in the comparison.