View methods side by side.
Choose up to four methods. Add them using the search and share the comparison by copying its link.
| Criterion |  UX Research Card Sorting | 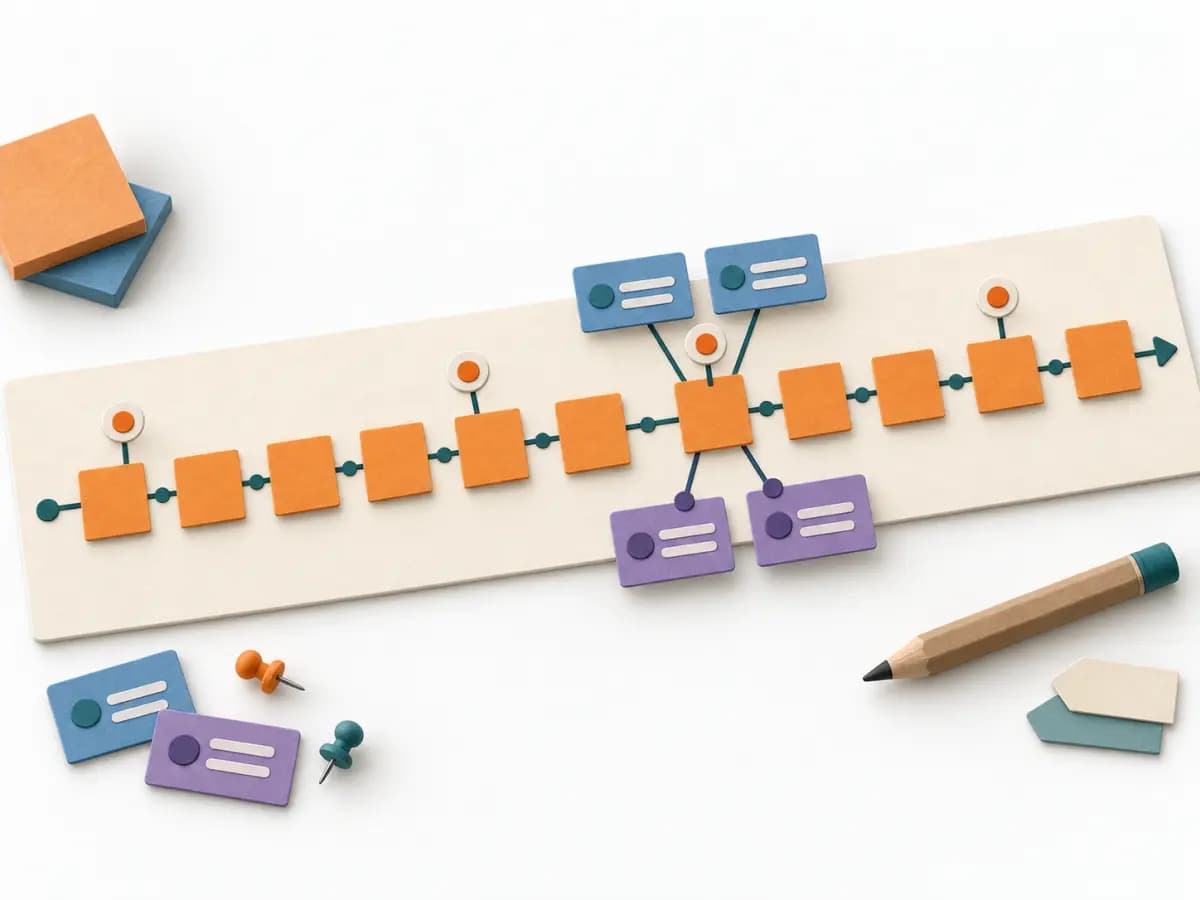 Domain Modeling EventStorming |  Domain Modeling Context Map |
|---|---|---|---|
Purposedifferent | When content only makes sense internally and users can't find the structure again, card sorting exposes their mental order. Terms, groups, and naming are then aligned with the target group's expectations. | When a domain consists of many events, rules, and states, it creates a shared modeling space for the team. It bundles language, flows, and boundaries before domain knowledge fragments into siloed views. | When several contexts need to talk to each other, it makes their relationships and dependencies legible. It helps sort integration pressure and responsibilities across system boundaries. |
Complexitydifferent | Low | Medium | Medium |
Timedifferent | 20-45 min | 2-8 h | 1-3 h |
Participantsdifferent | Based on research question | 5-12 | 2-8 |
Formatdifferent | Workshop + async | Workshop | Workshop + async |
Outputdifferent | Content groups, Label set, IA hypotheses | Event Timeline, Ubiquitous Language, Boundaries, Open Questions | Context Map, Integration Patterns, Boundary Notes |
Tagsno overlap | Information architectureNavigationStructure | Domain-Driven DesignEventsDiscoveryWorkshop | Domain-Driven DesignBoundariesStrategy |
Often compared together
Methods with strong topical overlap with the current selection, not yet in the comparison.