View methods side by side.
Choose up to four methods. Add them using the search and share the comparison by copying its link.
| Criterion | 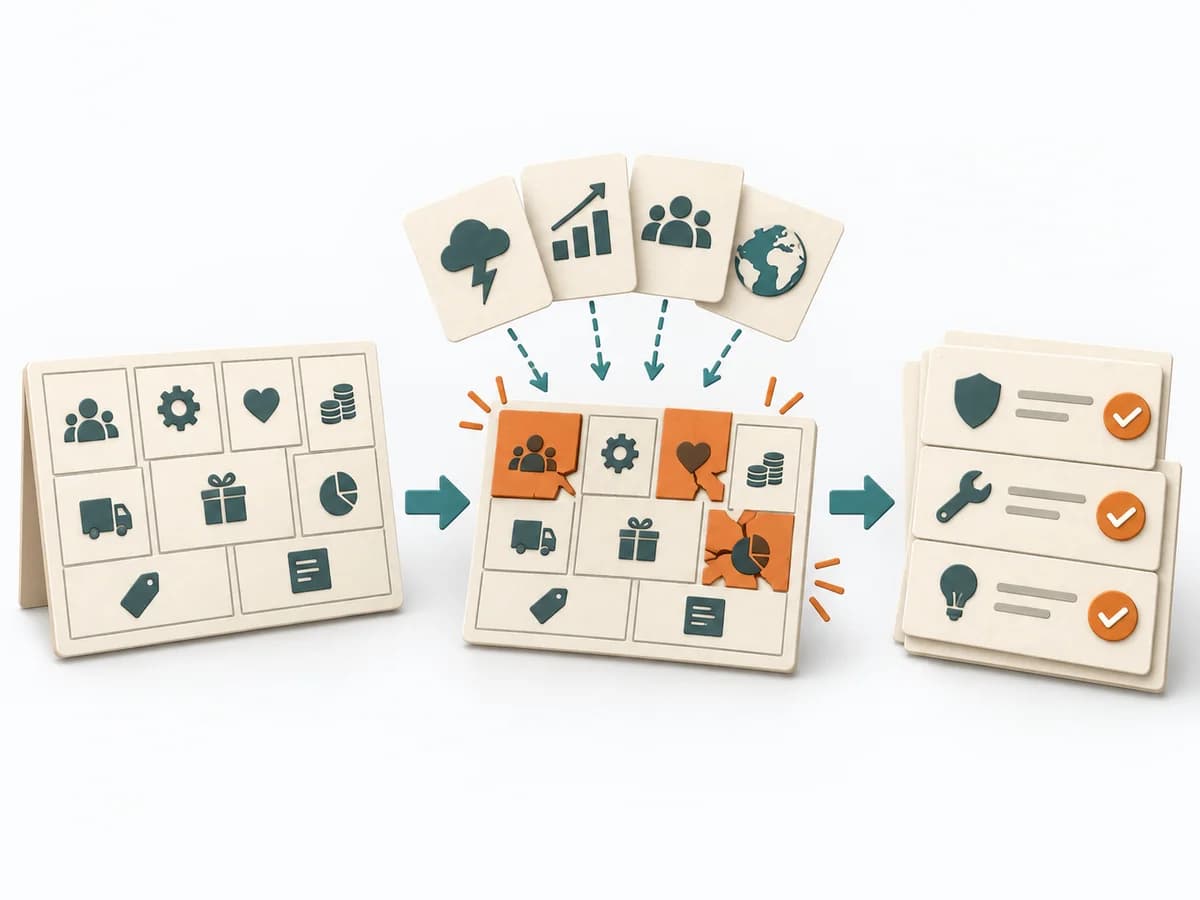 Business Strategy Business Model Stress Test |  Facilitation 3-Circle Venn Diagram | 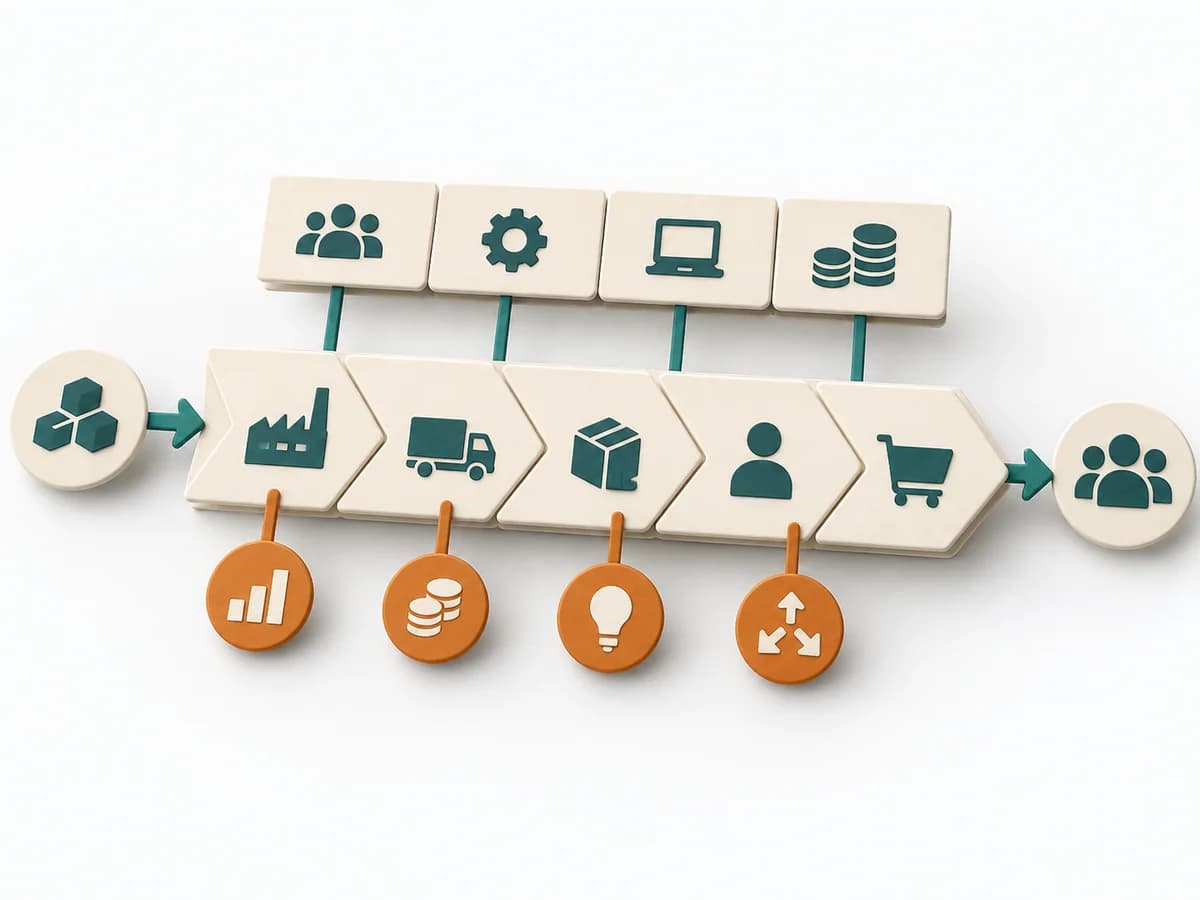 Business Strategy Value Chain Analysis |
|---|---|---|---|
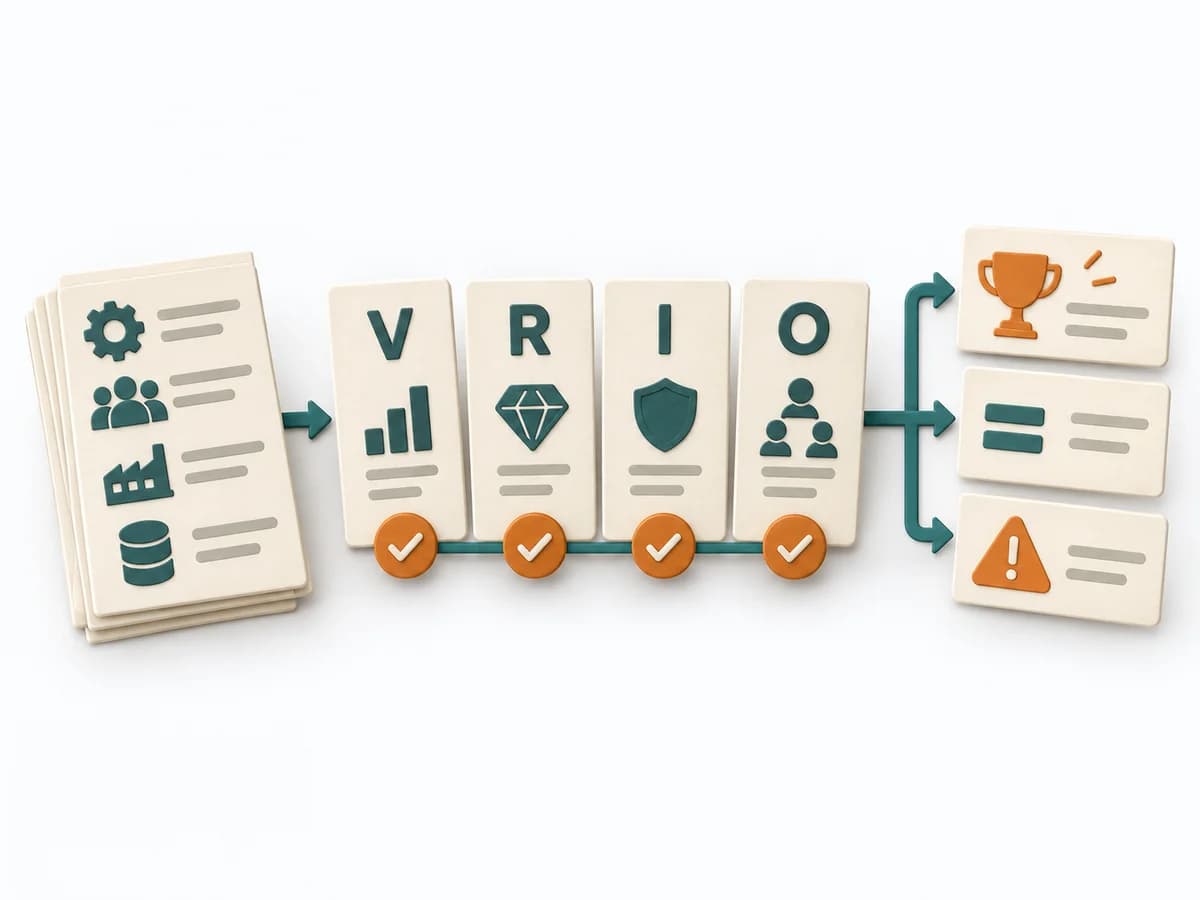
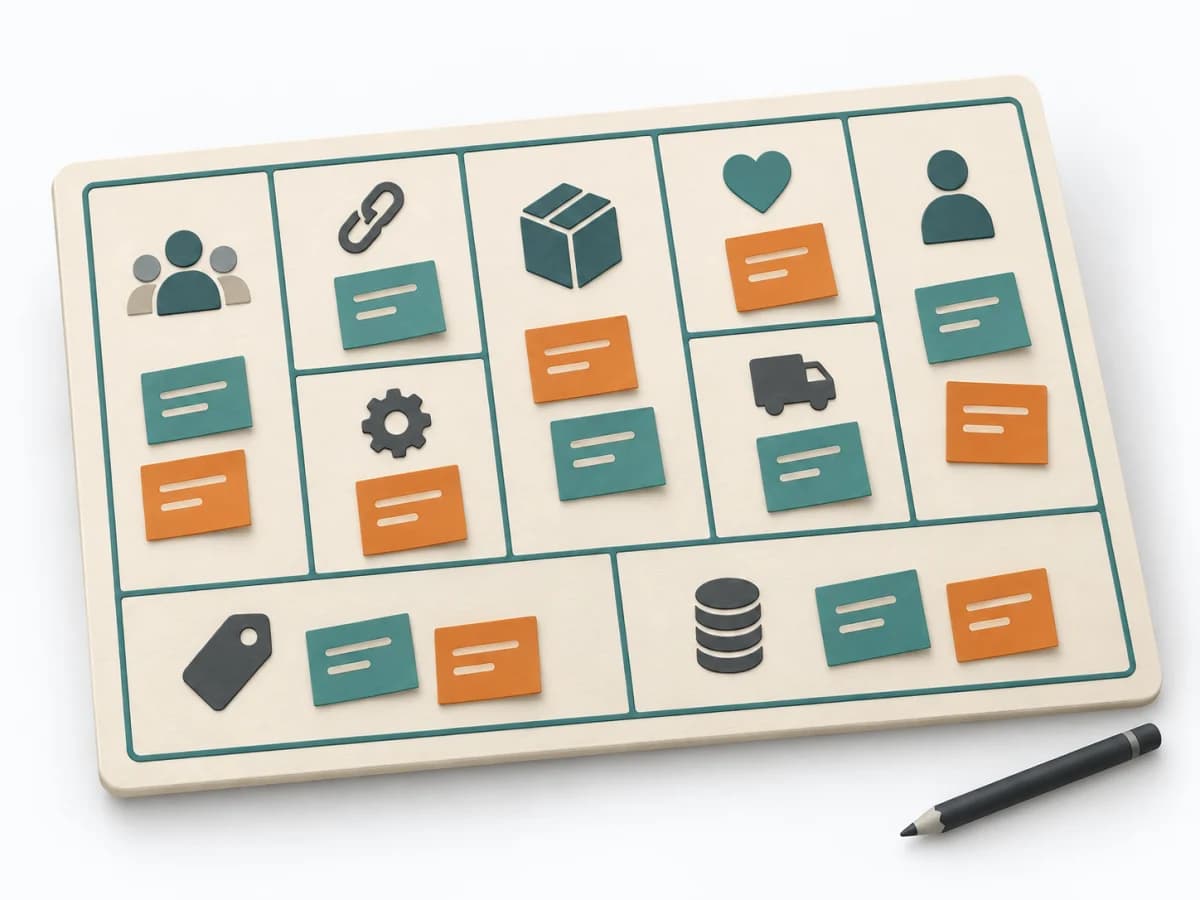
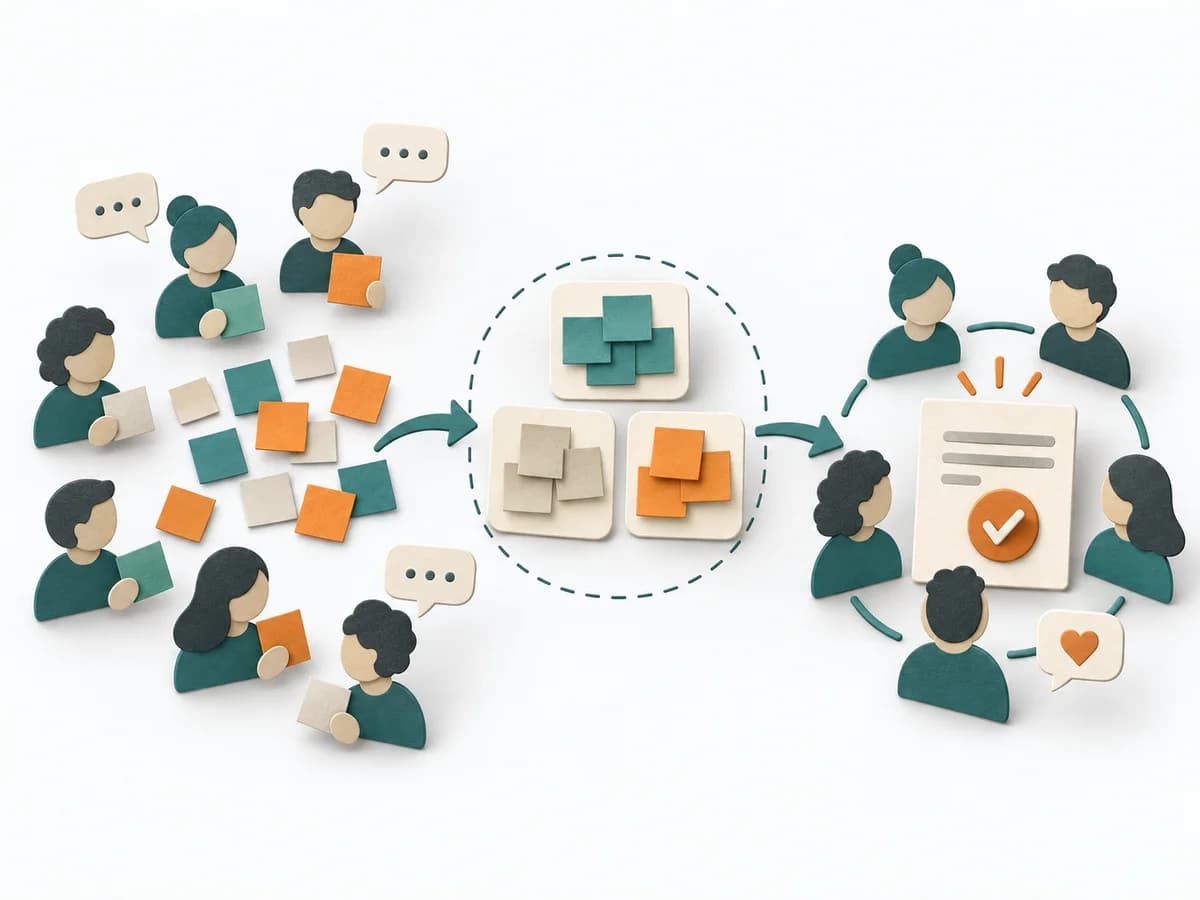
Purposedifferent | A Business Model Stress Test checks how well a business model holds up under pressure and headwinds. It compares strengths, risks, market logic, and courses of action. The result is captured as a stress-test report and action plan per scenario. | When three perspectives matter at the same time, a Three-Circle Venn Diagram shows the overlaps and remainders precisely. It makes visible where shared effect arises and where only a partial perspective applies. | Value Chain Analysis shows where value is created, costs accrue, and differentiation becomes possible along the process. It compares strengths, risks, market logic, and courses of action. The result is captured as a value-chain map and lever list. |
Complexitydifferent | High | Low | High |
Timedifferent | Half day | 15-45 min | Half day |
Participantsdifferent | 3-8 | 2-8 | 3-8 |
Formatdifferent | Workshop | Workshop + async | Workshop |
Outputdifferent | Stress Test Report, Action Plan per Scenario | Venn Diagram, Overlap Notes, Differentiators | Value Chain Map, Lever List |
Tagsno overlap | StrategyBusiness modelRiskDiagnosis | ComparisonFacilitationAlignment | StrategyBusiness modelDiagnosisAnalysis |
Often compared together
Methods with strong topical overlap with the current selection, not yet in the comparison.