View methods side by side.
Choose up to four methods. Add them using the search and share the comparison by copying its link.
| Criterion |  Systems Thinking Behavior Over Time Graph |  Innovation Reverse Brainstorming | 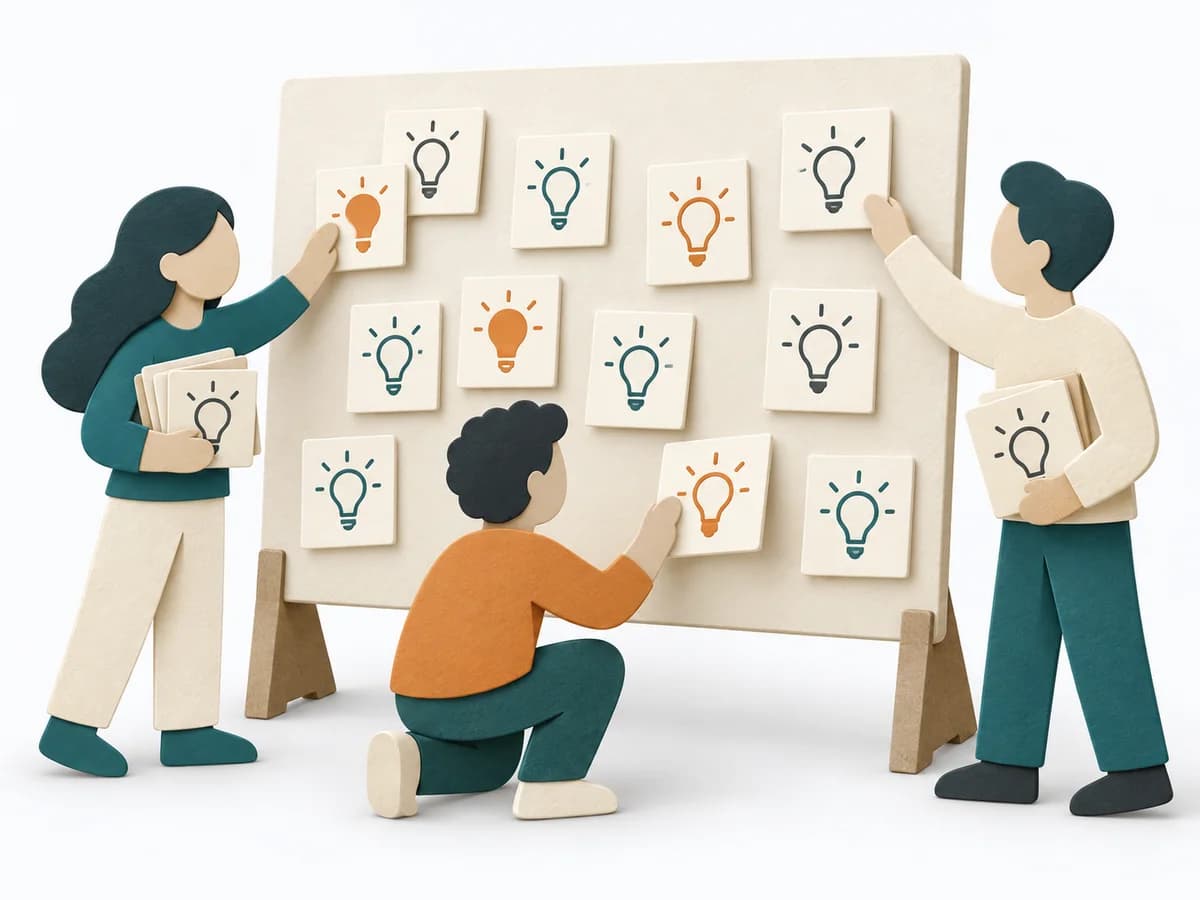 Innovation Brainstorming |
|---|---|---|---|
Purposedifferent | A Behavior Over Time Graph shows how a metric or observation develops over time. The method makes trends, breaks, and recurring patterns visible that get lost in snapshots. | For persistent errors or blockages, the method shifts the view to the opposite of the desired effect. It exposes the mechanics of failure and makes hidden causes easier to grasp. This makes improvement more concrete and the problem clearer. | When a team faces an open question with many obvious directions, the method first creates breadth instead of premature commitment. It separates idea flow from evaluation and makes lines of thought visible, creating a pool for selection and further development. |
Complexitysame | Low | Low | Low |
Timedifferent | 20-45 min | 30-60 min | 30-60 min |
Participantsdifferent | 1-10 | 3-12 | 4-12 |
Formatdifferent | Workshop + async | Workshop | Workshop |
Outputdifferent | Behavior Over Time Graph, Trend Hypotheses, Key Events | Reverse Ideas, Risk Themes, Solution Ideas | Idea pool, Theme clusters, Shortlist |
Tagsno overlap | Systems thinkingPatternsDynamics | BrainstormingIdeationCreativityRisk | BrainstormingIdeationCreativityWorkshopDivergence |
Often compared together
Methods with strong topical overlap with the current selection, not yet in the comparison.