View methods side by side.
Choose up to four methods. Add them using the search and share the comparison by copying its link.
| Criterion |  Systems Thinking Behavior Over Time Graph | 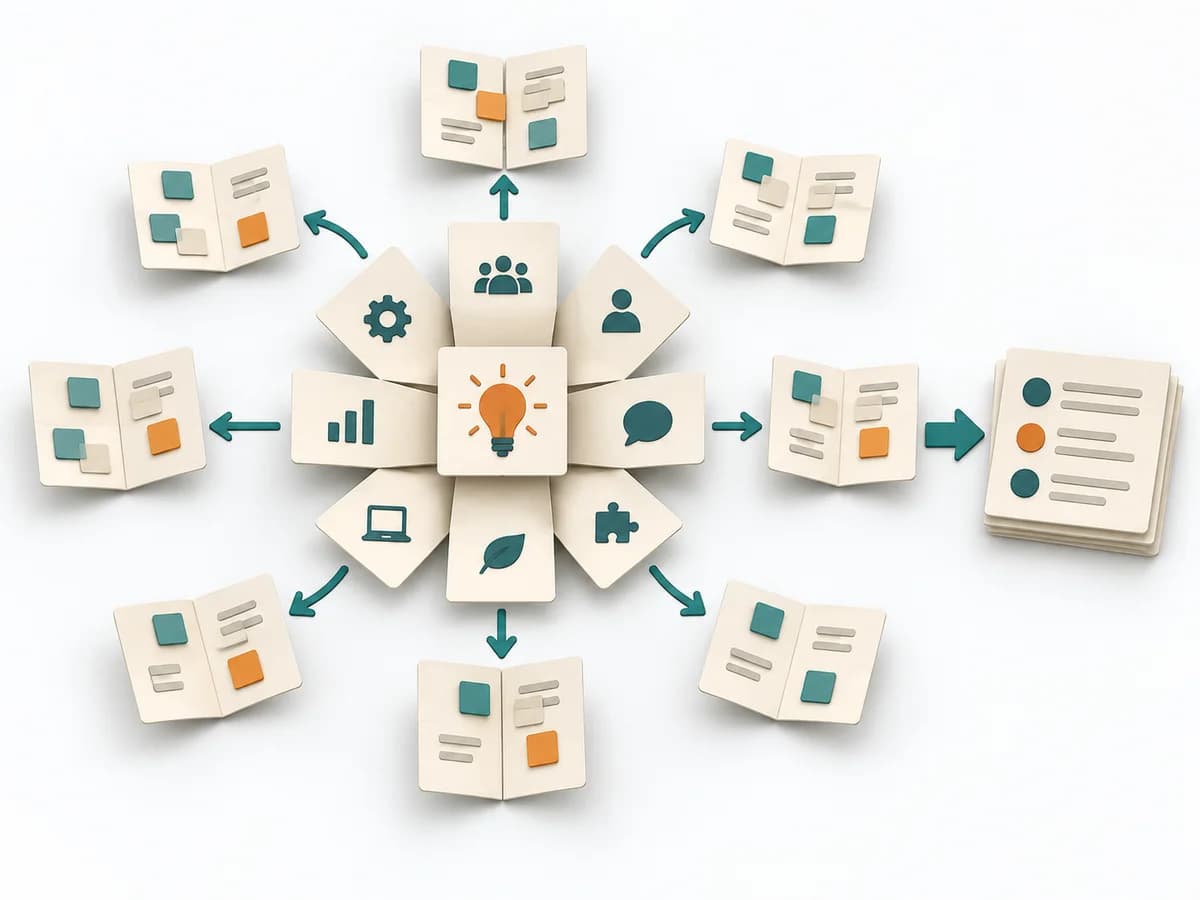 Innovation Lotus Blossom |  Innovation Design Charrette |
|---|---|---|---|
Purposedifferent | A Behavior Over Time Graph shows how a metric or observation develops over time. The method makes trends, breaks, and recurring patterns visible that get lost in snapshots. | When a central question feels too large, the method breaks it into neighboring topic fields with their own depth of ideation. It holds structure and openness at the same time, so adjacent perspectives don't get lost. This grows an idea space out of a core problem. | In a tightly timed design process with many participants, the method pools several lines of thinking in a short time. It brings parallel design energy without letting the discussion tip into endless coordination. This quickly produces solid directions for architecture or space. |
Complexitydifferent | Low | Low | Medium |
Timedifferent | 20-45 min | 45-90 min | Halber Tag bis mehrere Tage |
Participantsdifferent | 1-10 | 3-10 | 10-50 |
Formatdifferent | Workshop + async | Workshop | Workshop |
Outputdifferent | Behavior Over Time Graph, Trend Hypotheses, Key Events | Lotus Diagram, Idea Themes, Shortlist | Sketches and Concepts, Consolidated Solution Sketch, Prioritized Direction |
Tagsno overlap | Systems thinkingPatternsDynamics | BrainstormingIdeationCreativityDivergenceWorkshop | BrainstormingWorkshopCollaborationIdeation |
Often compared together
Methods with strong topical overlap with the current selection, not yet in the comparison.