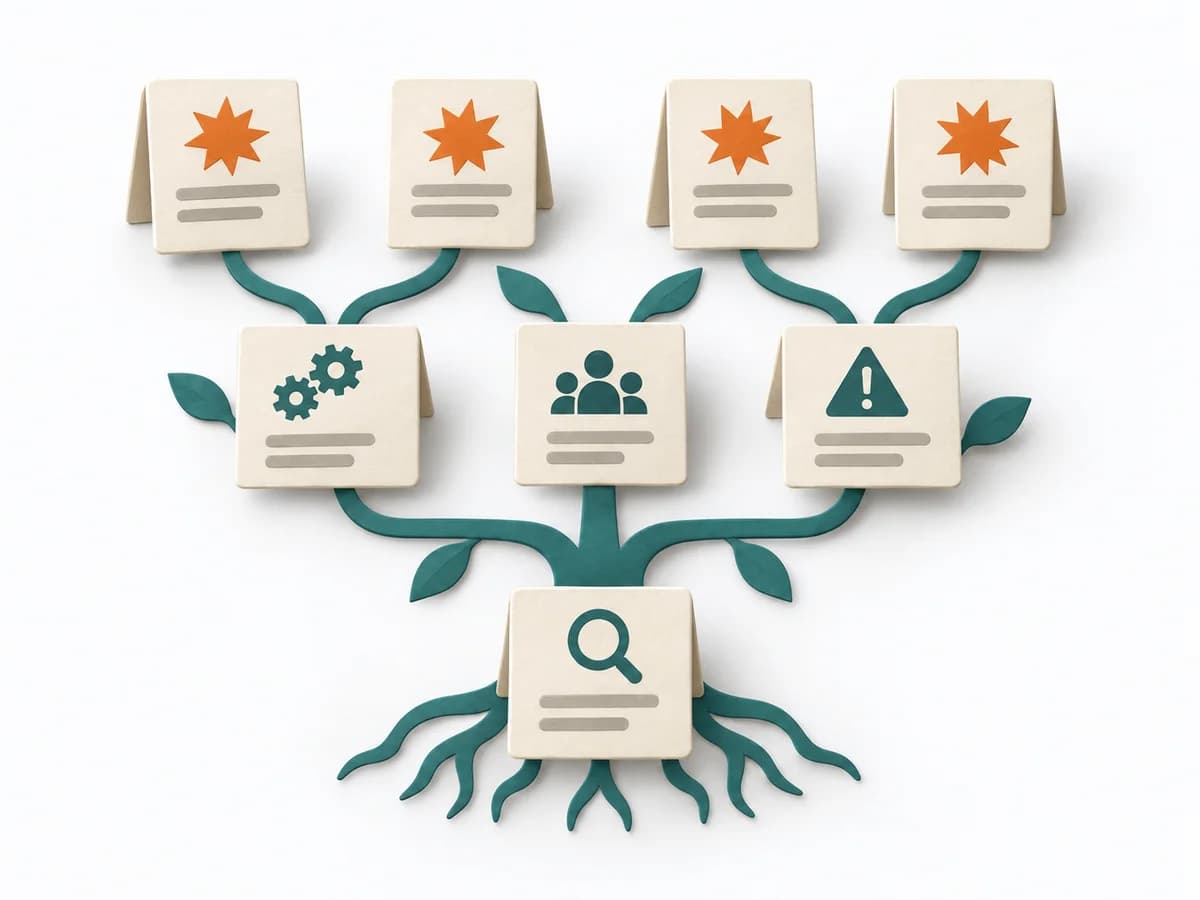
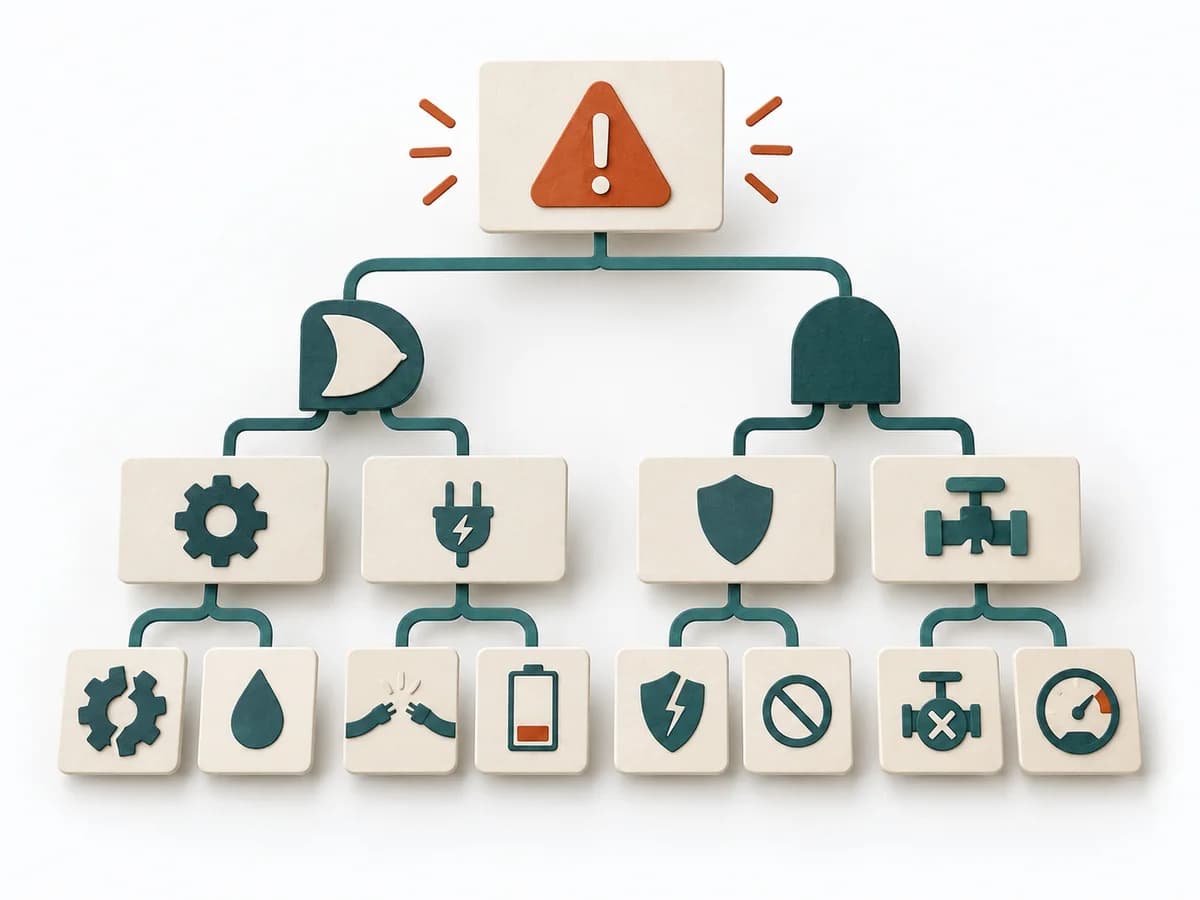
View methods side by side.
Choose up to four methods. Add them using the search and share the comparison by copying its link.
| Criterion |  UX Research Affinity Diagramming | 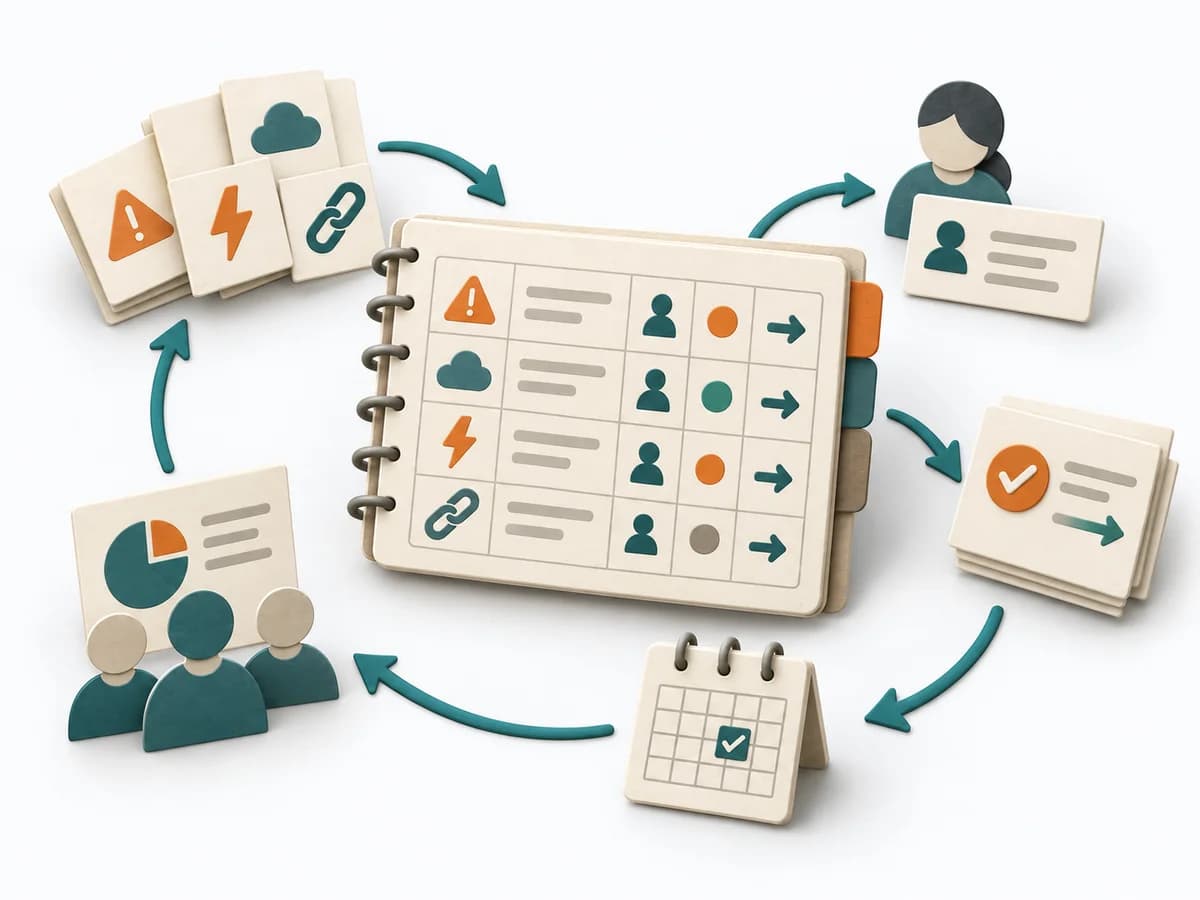 Delivery RAID Log | 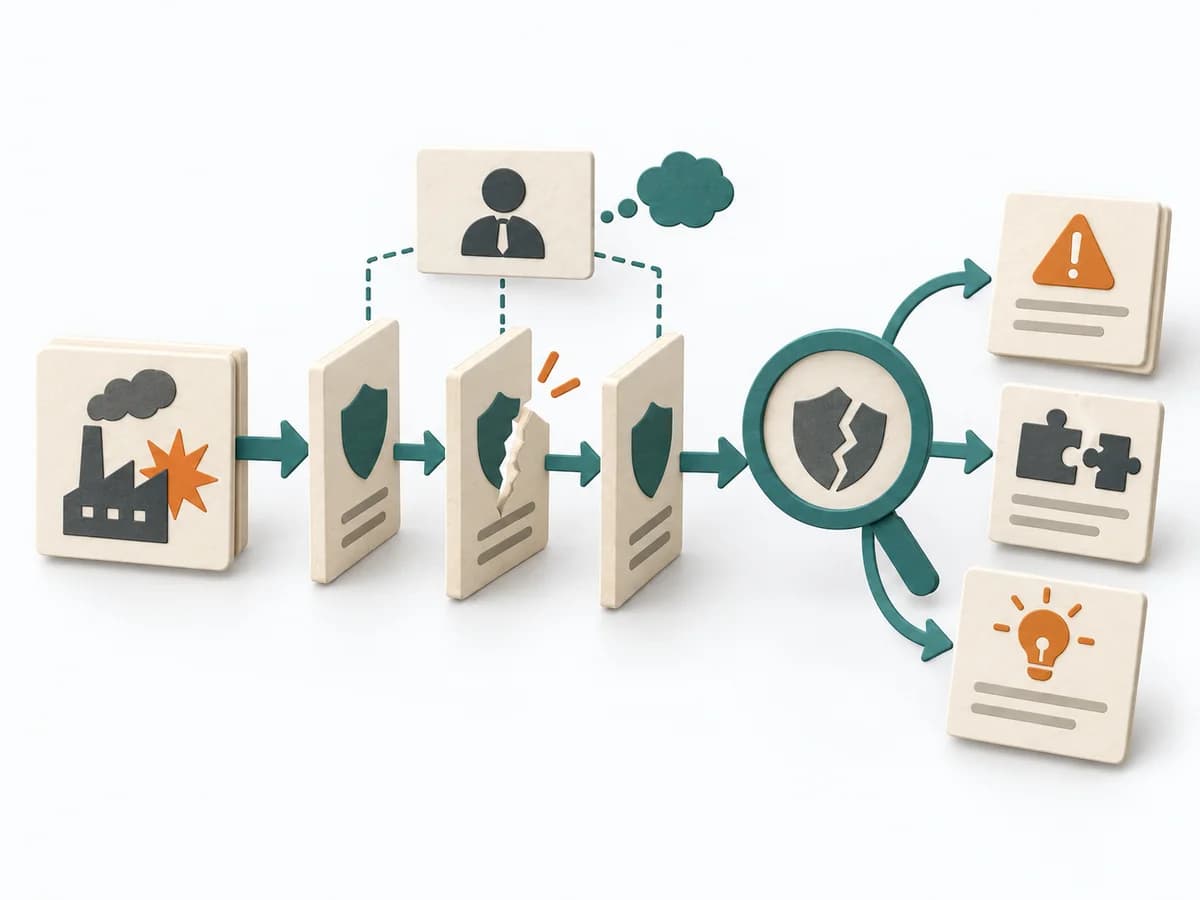 Operations MORT Analysis |
|---|---|---|---|
Purposedifferent | When research notes, feedback, or observations sit unconnected side by side, affinity diagramming sorts the raw material into solid themes. Many individual points turn into patterns that make decisions and opportunities clearer. | Helps clarify scope, sequence, and delivery flow in concrete terms. It makes work, boundaries, and order steerable. The result is captured as a RAID Log and a source for status reporting. | For a safety-relevant event or a system with high protection requirements, the method examines where controls failed. It exposes both technical and organizational gaps. |
Complexitydifferent | Low | Low | High |
Timedifferent | 45–90 min | 30 min Setup, dann laufend | Mehrere Tage bis Wochen |
Participantsdifferent | 3-10 | 1-3 maintaining, briefing for everyone | 2-6 |
Formatdifferent | Workshop | Async | Workshop + async |
Outputdifferent | Theme clusters, Insight statements, Opportunity areas | RAID Log, Status Report Source | MORT Worksheets, Findings per Branch, Corrective Actions, Systemic Recommendations |
Tagsno overlap | SynthesisQualitativeRoot cause | RiskTrackingStakeholdersGovernance | Root causeSafetySystemicIncident |
Often compared together
Methods with strong topical overlap with the current selection, not yet in the comparison.