View methods side by side.
Choose up to four methods. Add them using the search and share the comparison by copying its link.
| Criterion |  UX Research Affinity Diagramming | 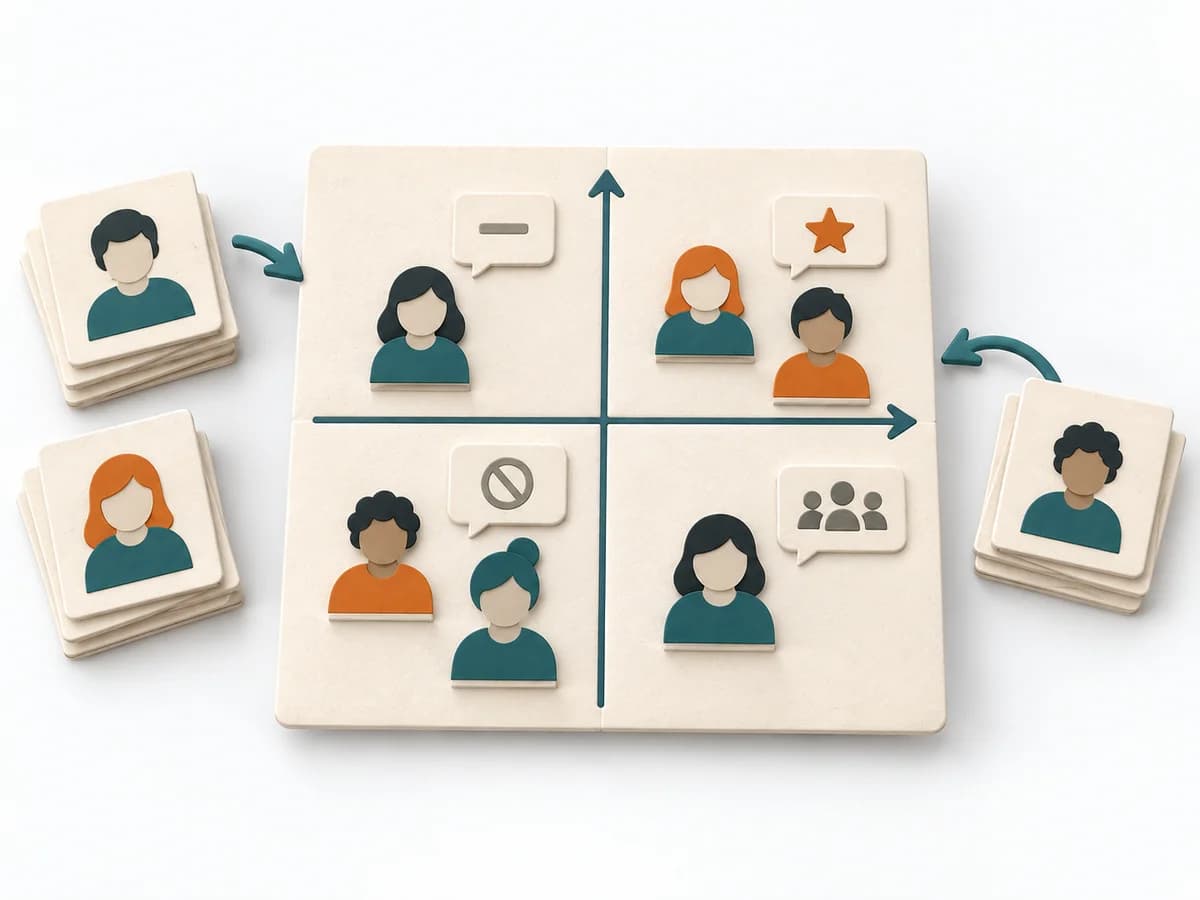 Facilitation Power Interest Grid | 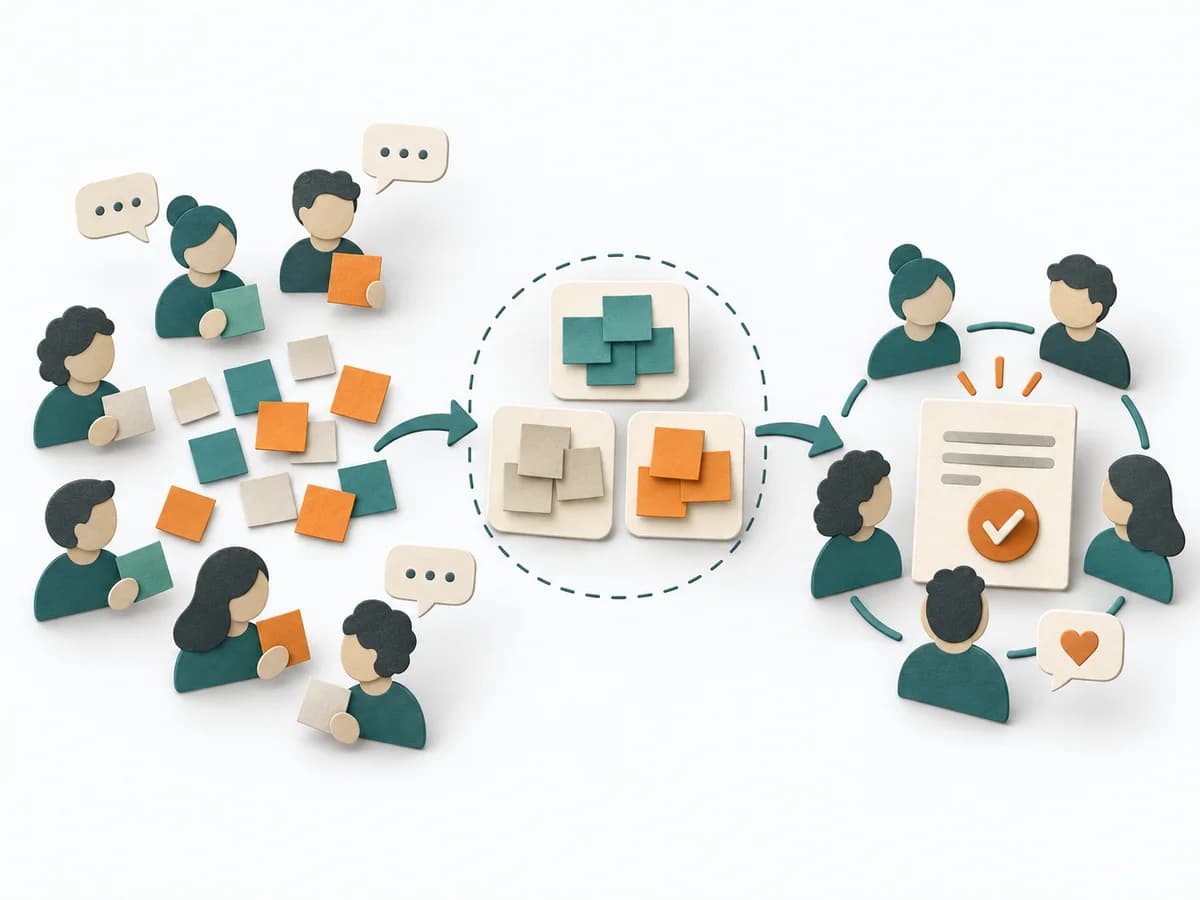 Facilitation Consensus Workshop |
|---|---|---|---|
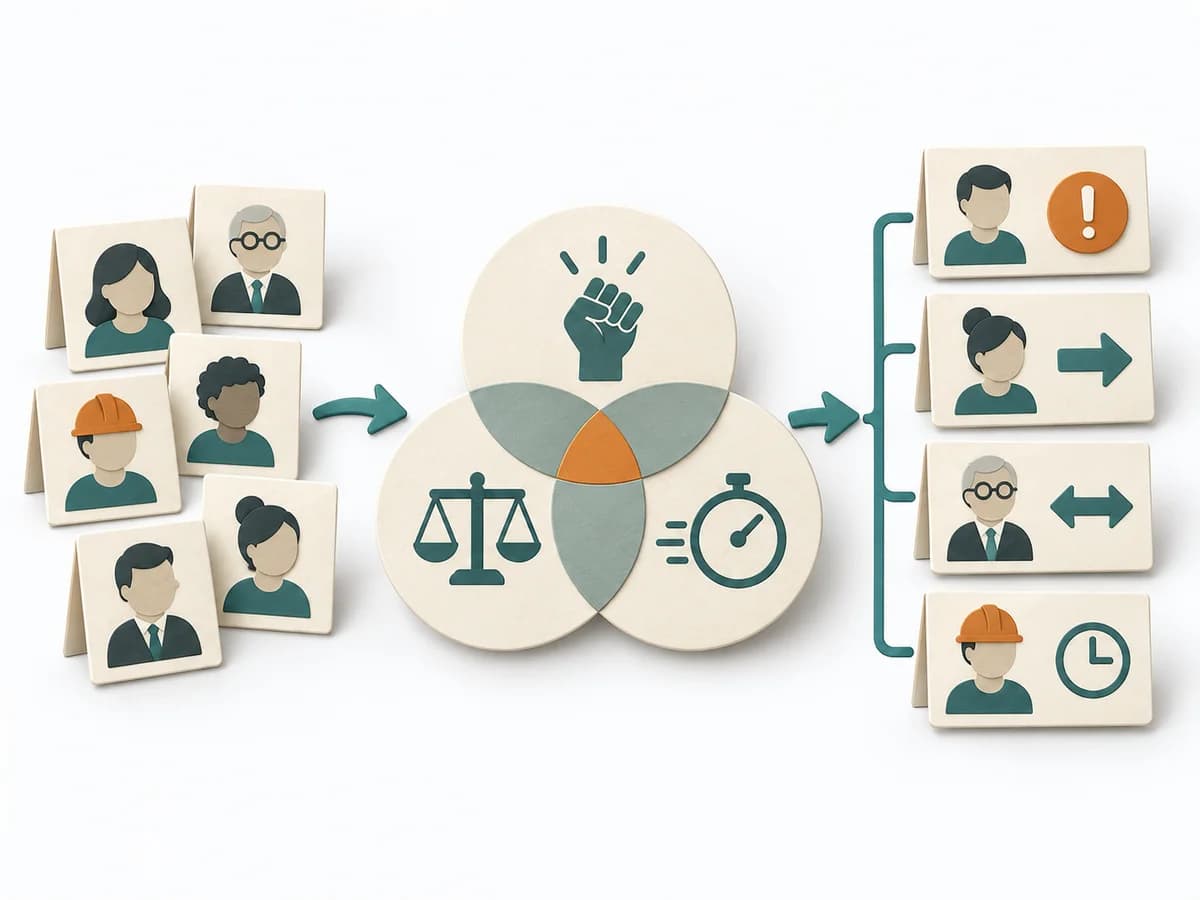
Purposedifferent | When research notes, feedback, or observations sit unconnected side by side, affinity diagramming sorts the raw material into solid themes. Many individual points turn into patterns that make decisions and opportunities clearer. | When many stakeholders compete for attention at once, the Power Interest Grid sorts them by influence and stake. It turns individual contributions into a visible selection. The result is captured as a Power Interest Grid and a stakeholder-specific strategy. | When a group needs a solid decision without outvoting individual factions, a Consensus Workshop creates a negotiable common ground. It makes agreement, reservations, and open tensions discussable at the same time. |
Complexitydifferent | Low | Low | Medium |
Timedifferent | 45–90 min | 30-60 min | 1-3 h |
Participantsdifferent | 3-10 | 2-8 | 5-30 |
Formatsame | Workshop | Workshop | Workshop |
Outputdifferent | Theme clusters, Insight statements, Opportunity areas | Power Interest Grid, Strategy per Stakeholder | Consensus Clusters, Theme Titles, Priority Areas |
Tagsno overlap | SynthesisQualitativeRoot cause | StakeholdersFacilitationAlignmentPlanning | FacilitationConsensusWorkshopAlignment |
Often compared together
Methods with strong topical overlap with the current selection, not yet in the comparison.