View methods side by side.
Choose up to four methods. Add them using the search and share the comparison by copying its link.
| Criterion |  Agile WSJF |  Product Strategy RICE Scoring | 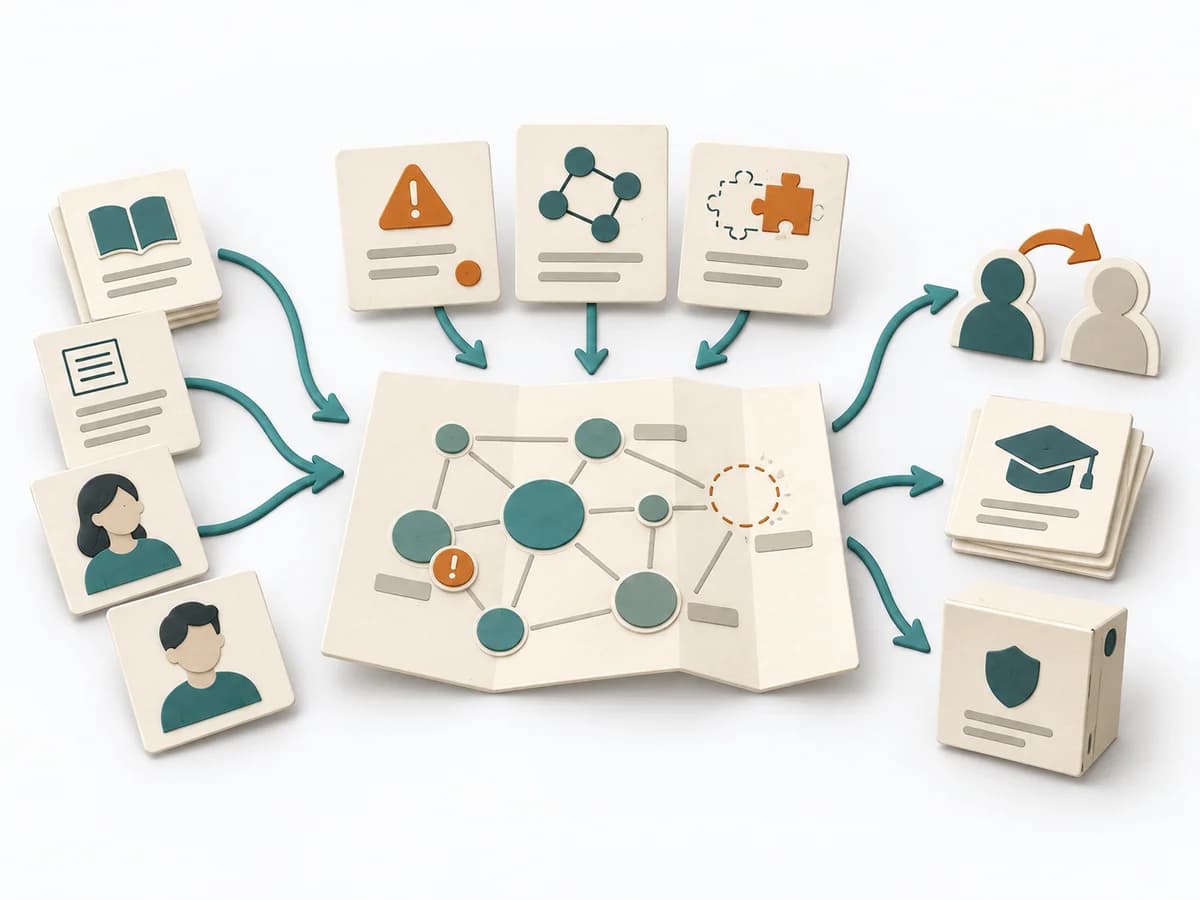 Knowledge Modeling Knowledge Mapping |
|---|---|---|---|
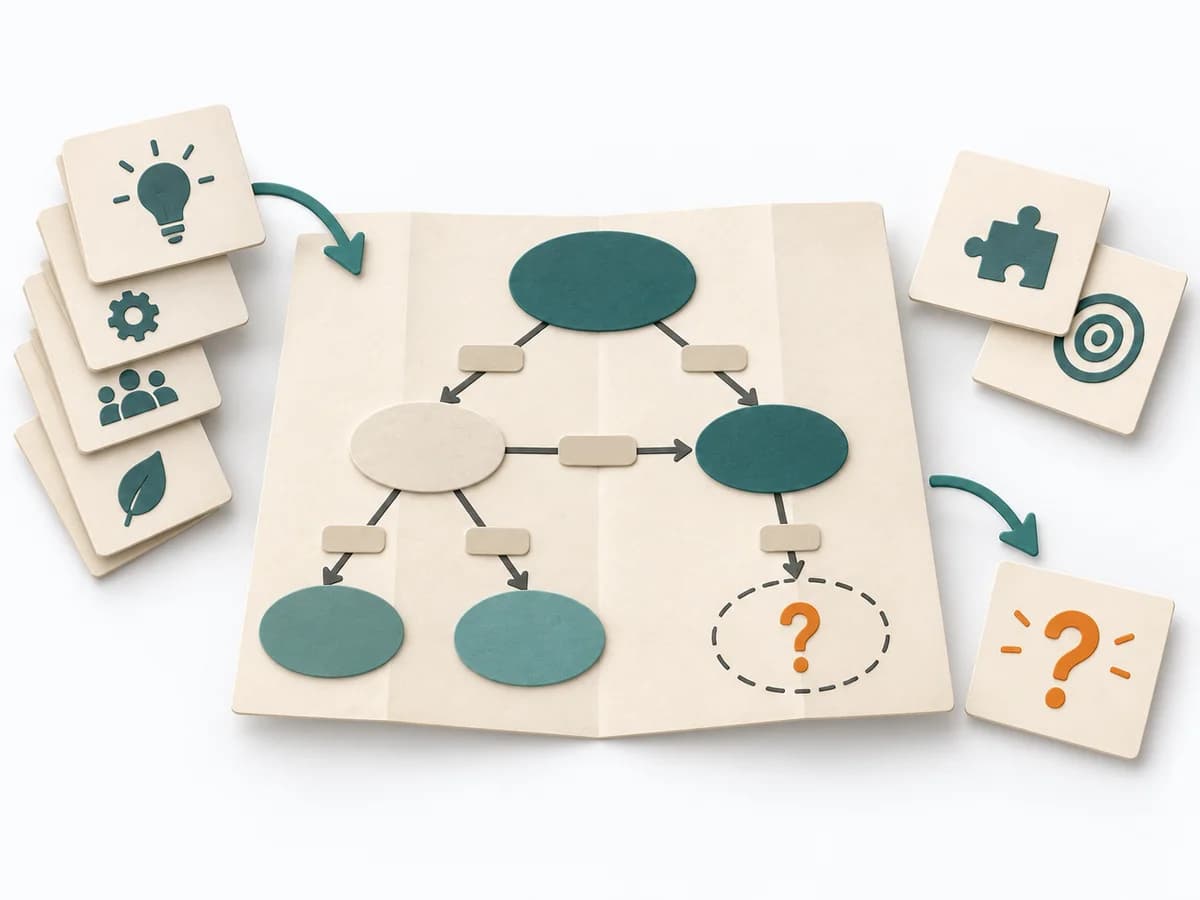
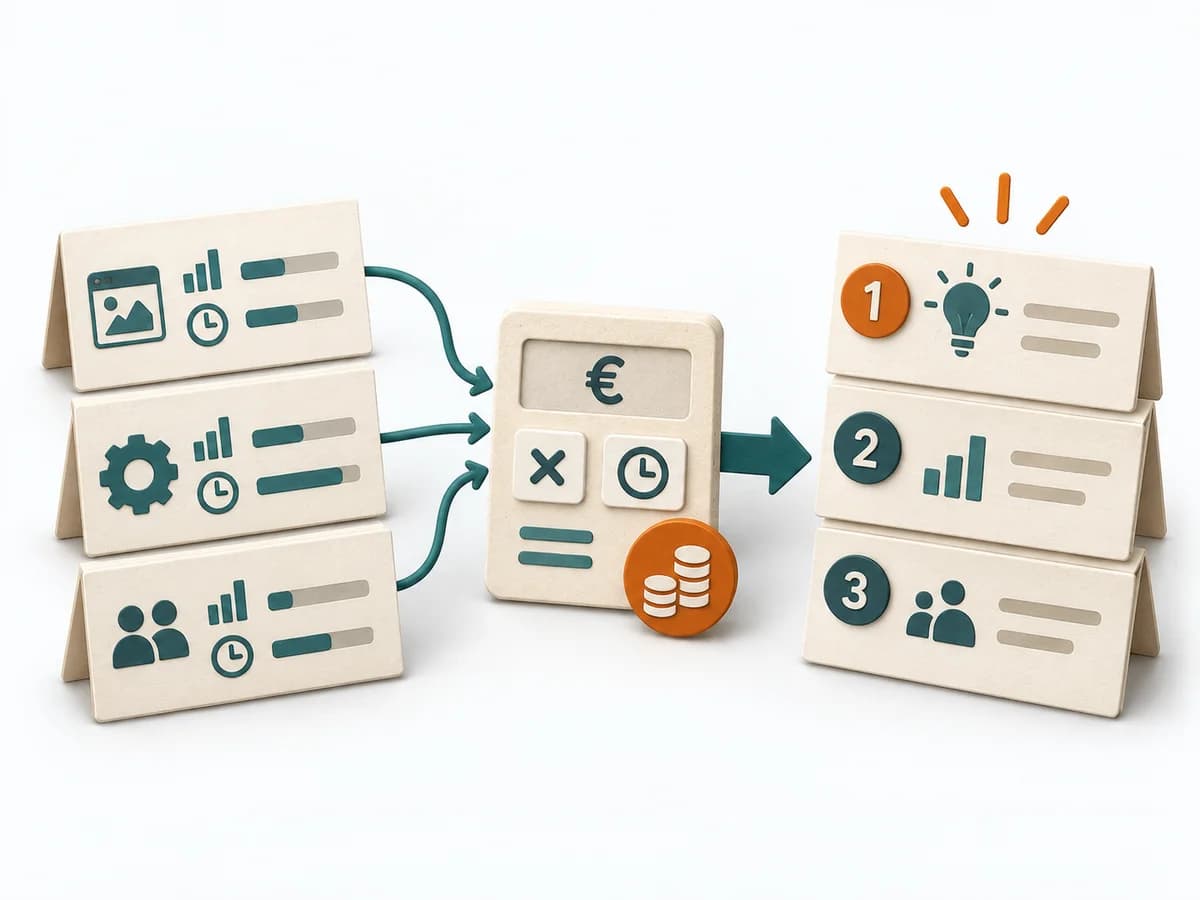
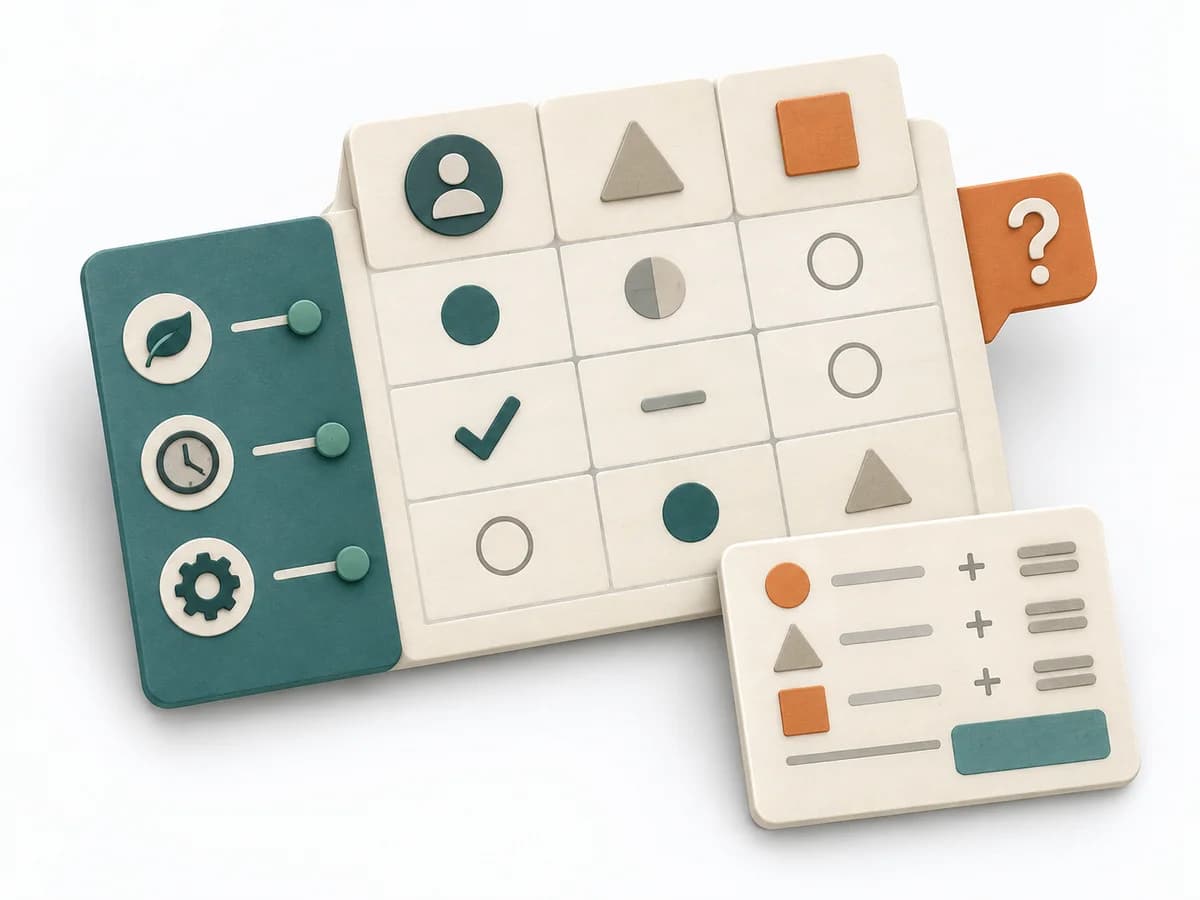
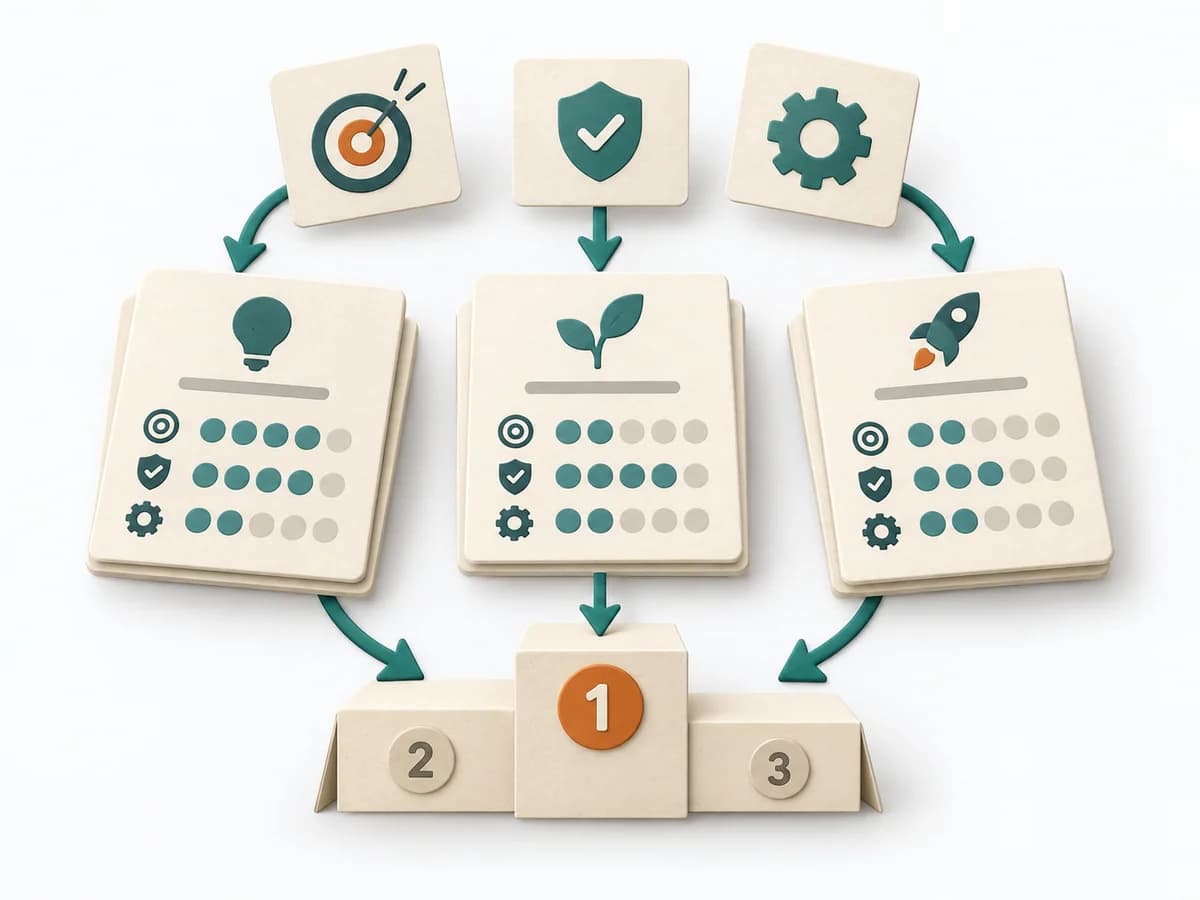
Purposedifferent | When many tasks compete for the same capacity, it orders work by economic impact. It makes time lost, benefit, and effort comparable together. | When many initiatives compete for the same resources, it brings reach, impact, confidence, and effort into one shared ranking. It makes prioritization economically connectable. | Knowledge Mapping makes knowledge, gaps, and transfer paths visible across a field. It fits when expertise should not just exist but also be findable and transferable. |
Complexitydifferent | High | Medium | Medium |
Timedifferent | 45-90 min | 60-90 min | 1-3 h |
Participantsdifferent | 3-10 | 2-10 | 3-12 |
Formatdifferent | Workshop | Workshop + async | Workshop |
Outputdifferent | Ranked Backlog, Cost-of-Delay Assumptions | RICE Scores, Ranked List, Assumption Log | Knowledge Map, Critical Knowledge Areas, Transfer Plan |
Tagsno overlap | LeanEconomicsSequencePrioritization | PrioritizationScoringRoadmapTradeoffs | KnowledgeMappingRisk |
Often compared together
Methods with strong topical overlap with the current selection, not yet in the comparison.