View methods side by side.
Choose up to four methods. Add them using the search and share the comparison by copying its link.
| Criterion | 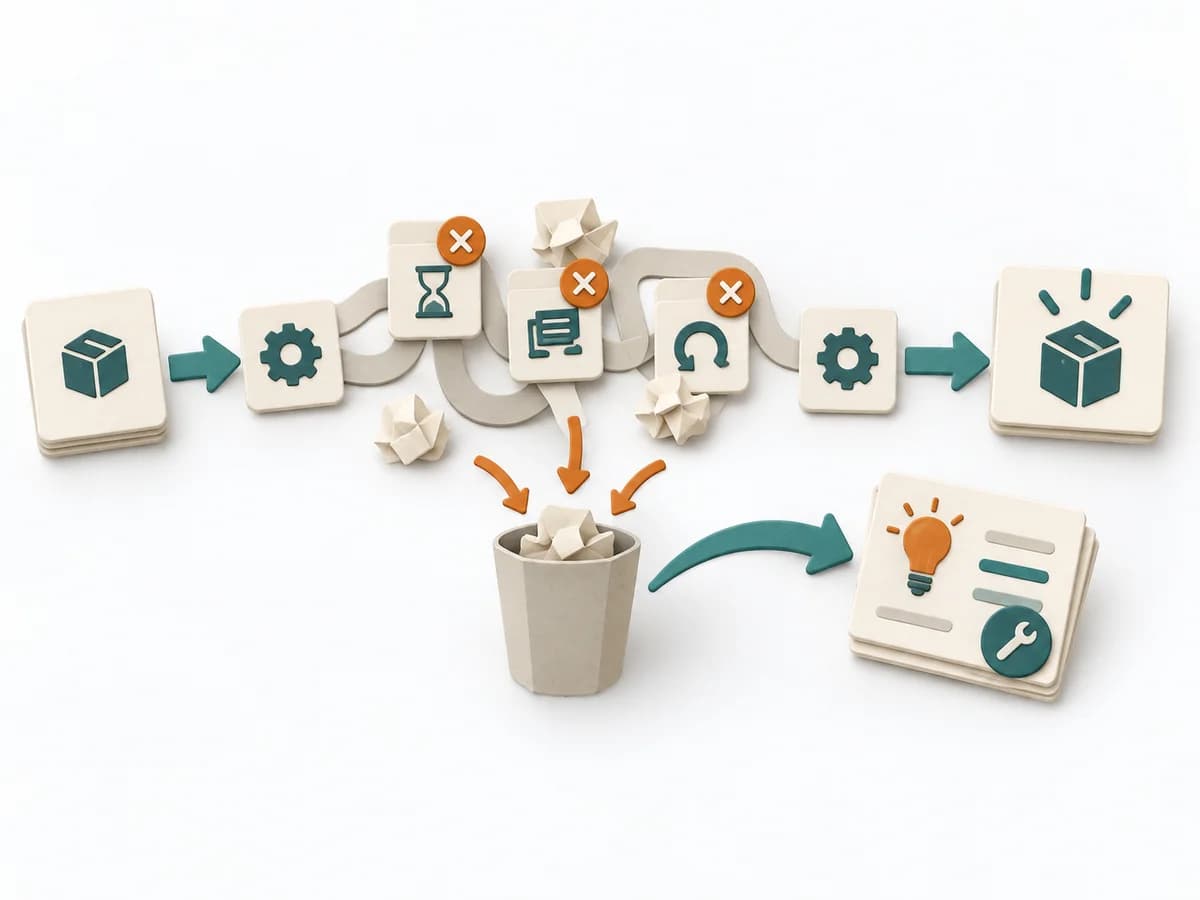 Operations Waste Analysis | 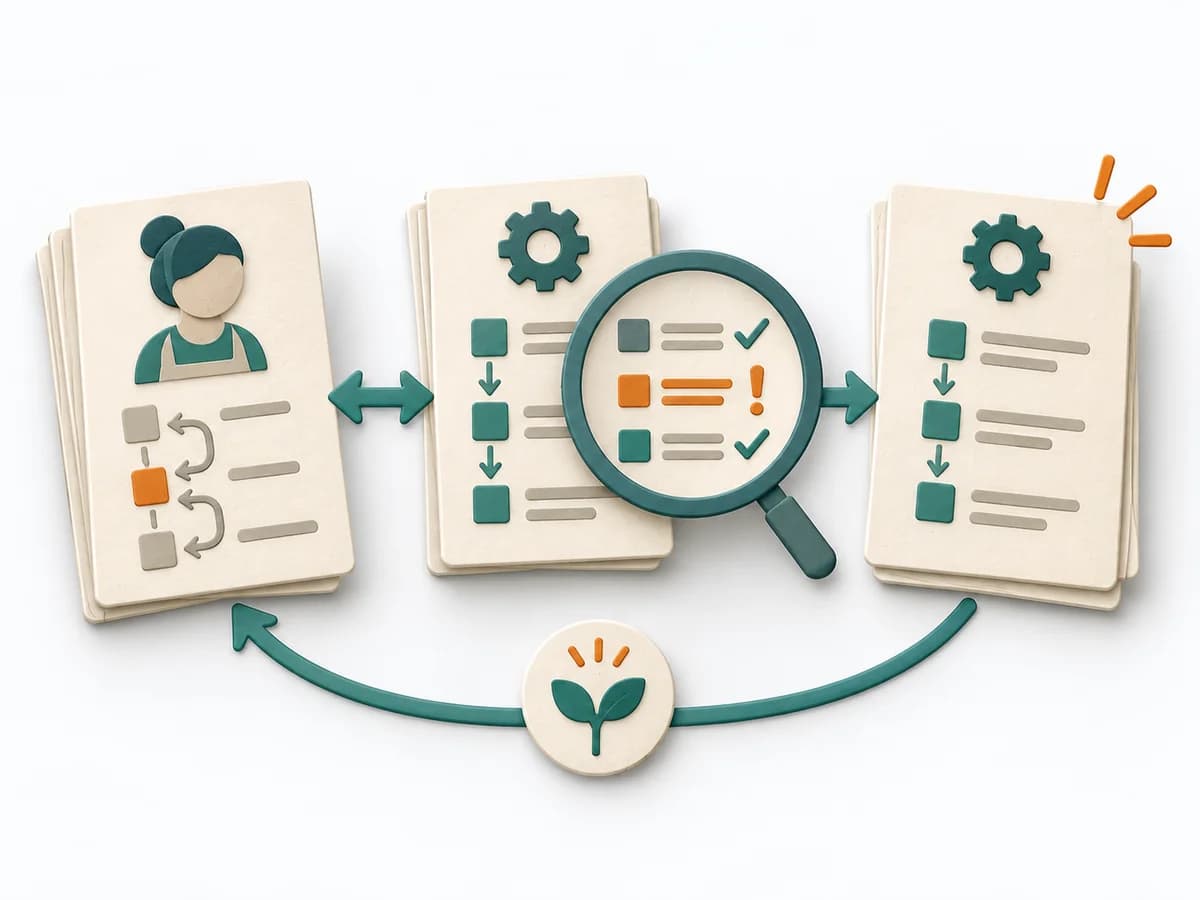 Operations Standard Work Analysis |  Operations Failure Mode and Effects Analysis |
|---|---|---|---|
Purposedifferent | For a process that keeps people busy but creates little value, the method exposes waste. It directs attention to unnecessary movement, waiting times, rework, and overdelivery. | When the same task is done differently depending on the person, the method exposes the reliable core. It creates comparability without unnecessarily choking off needed latitude. | For a process, product, or service with noticeable failure risks, the method assesses possible failure modes in advance. It directs attention to combinations of occurrence, effect, and detectability. |
Complexitydifferent | Low | Medium | High |
Timedifferent | 45-120 min | 1-3 h | 2-6 h |
Participantsdifferent | 2-8 | 2-6 | 3-10 |
Formatsame | Workshop | Workshop | Workshop |
Outputdifferent | Waste Map, Prioritized Waste, Improvement Backlog | Standard Work Sheet, Deviation List, Improved Standard, Training Needs | FMEA Table, Risk Priority, Mitigation Actions |
Tagsno overlap | WasteLeanProcess improvement | LeanProcessQuality | RiskQualityOperationsRoot cause |
Often compared together
Methods with strong topical overlap with the current selection, not yet in the comparison.