View methods side by side.
Choose up to four methods. Add them using the search and share the comparison by copying its link.
| Criterion | 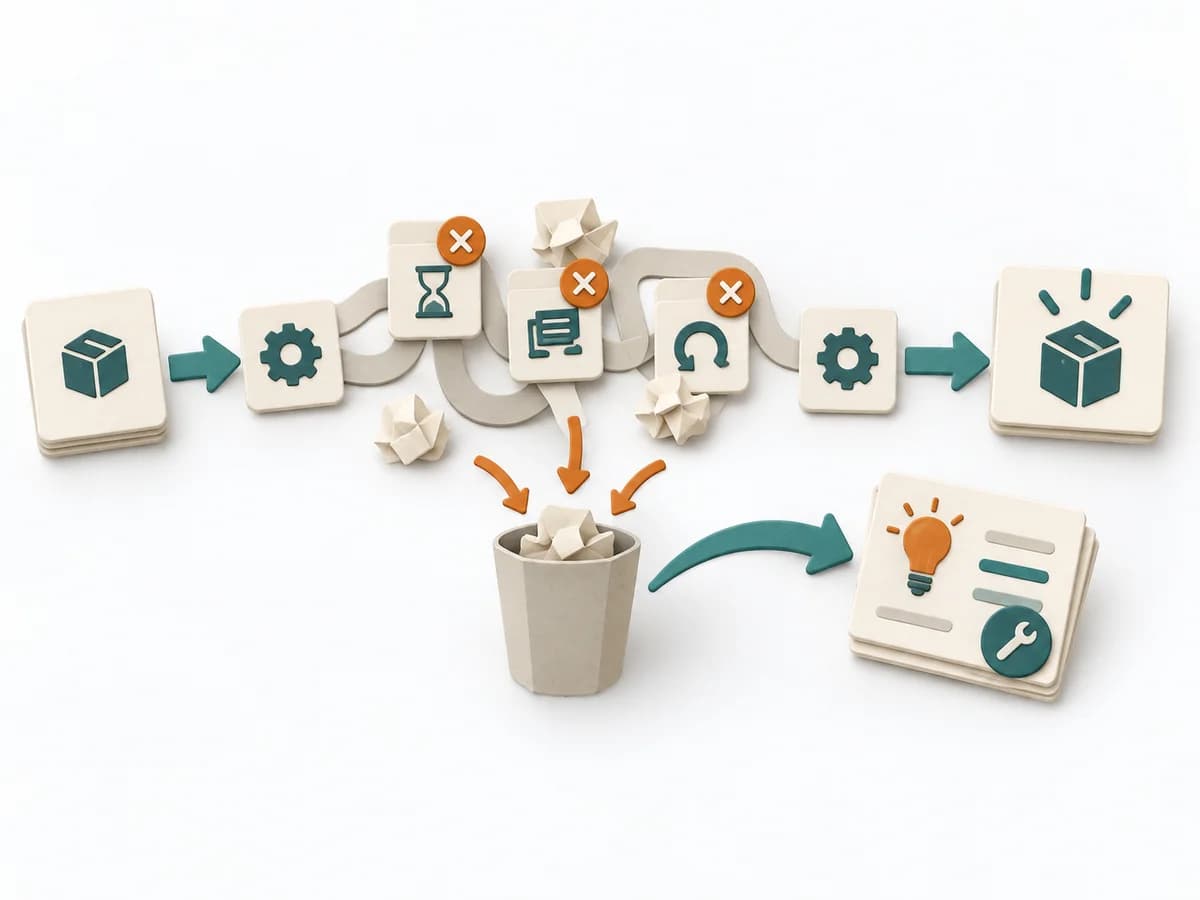 Operations Waste Analysis | 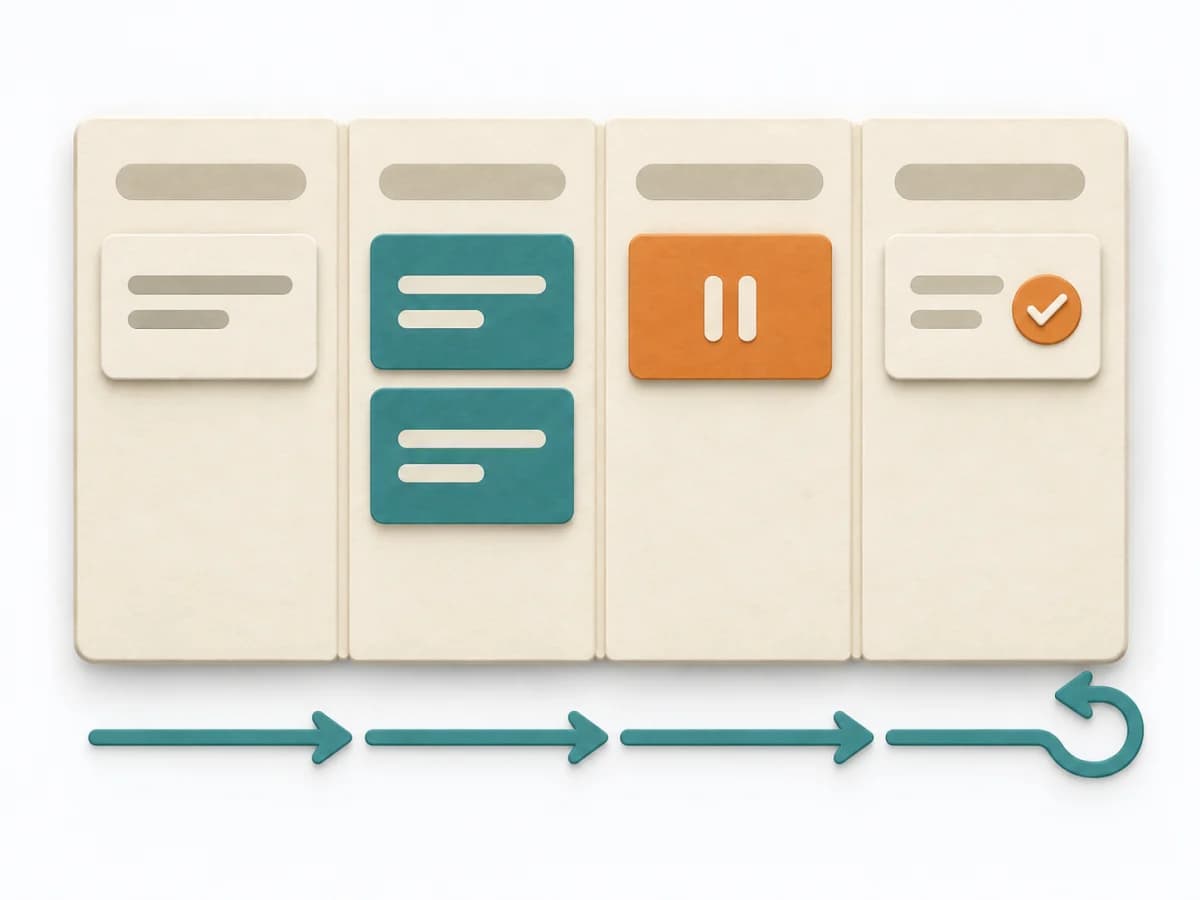 Engineering Kanban |  Facilitation Dot Estimation |
|---|---|---|---|
Purposedifferent | For a process that keeps people busy but creates little value, the method exposes waste. It directs attention to unnecessary movement, waiting times, rework, and overdelivery. | When work sits in too many parallel streams, throughput suffers and no one sees the bottlenecks. Kanban makes the flow of work visible and limits overload so a system becomes calmer and more predictable. | When size or effort can only be estimated roughly, Dot Estimation condenses the group's experience into a quick range. It turns individual contributions into a visible selection. The result is captured as an Effort Heatmap, Risk Signals, and Discussion Targets. |
Complexitydifferent | Low | Medium | Low |
Timedifferent | 45-120 min | Ongoing | 5-20 min |
Participantsdifferent | 2-8 | 2-12 | 3-20 |
Formatdifferent | Workshop | Workshop + async | Workshop |
Outputdifferent | Waste Map, Prioritized Waste, Improvement Backlog | Kanban board, WIP policies, Flow metrics | Effort Heatmap, Risk Signals, Discussion Targets |
Tagsno overlap | WasteLeanProcess improvement | FlowVisual managementDelivery | EstimationEffortRisk |
Often compared together
Methods with strong topical overlap with the current selection, not yet in the comparison.