View methods side by side.
Choose up to four methods. Add them using the search and share the comparison by copying its link.
| Criterion |  Operations Visual Management | 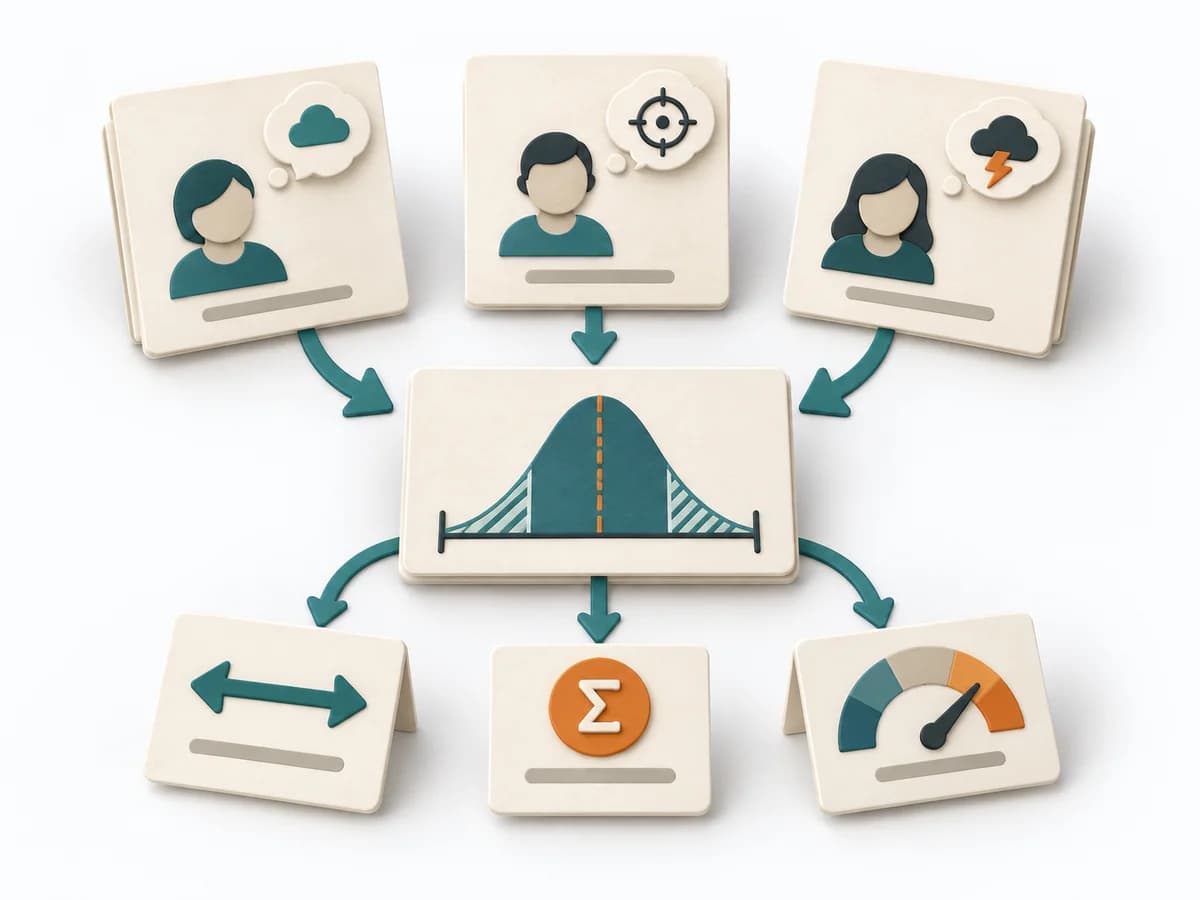 Decision Making Three-Point Estimation | 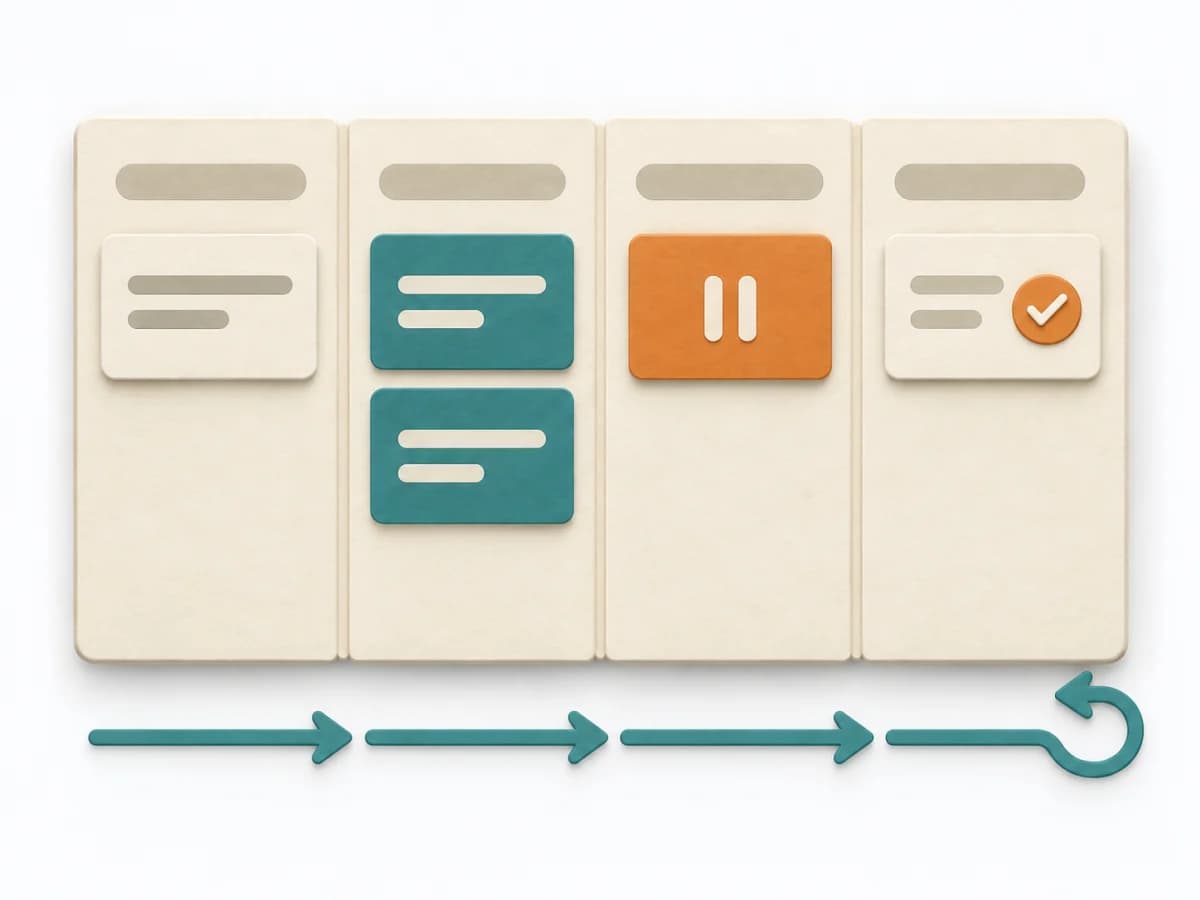 Engineering Kanban |
|---|---|---|---|
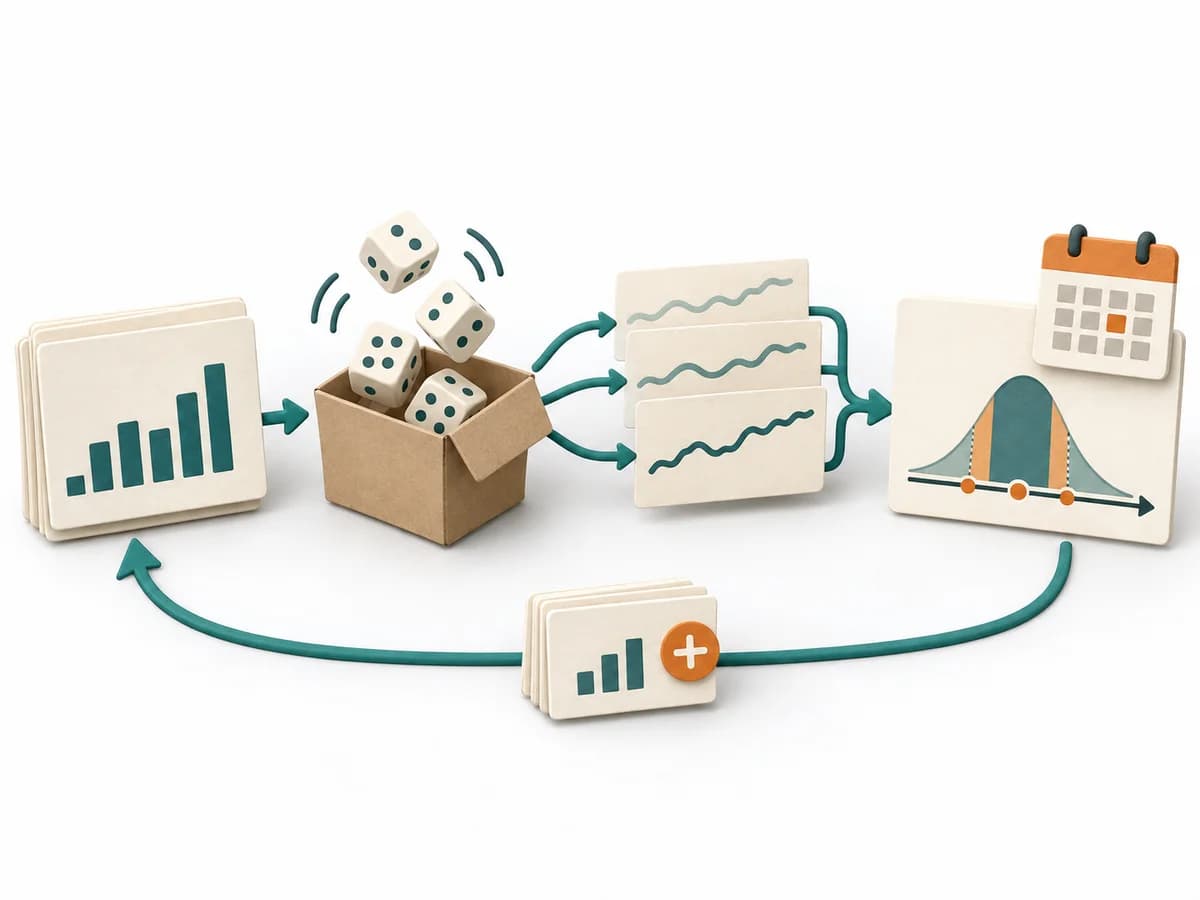
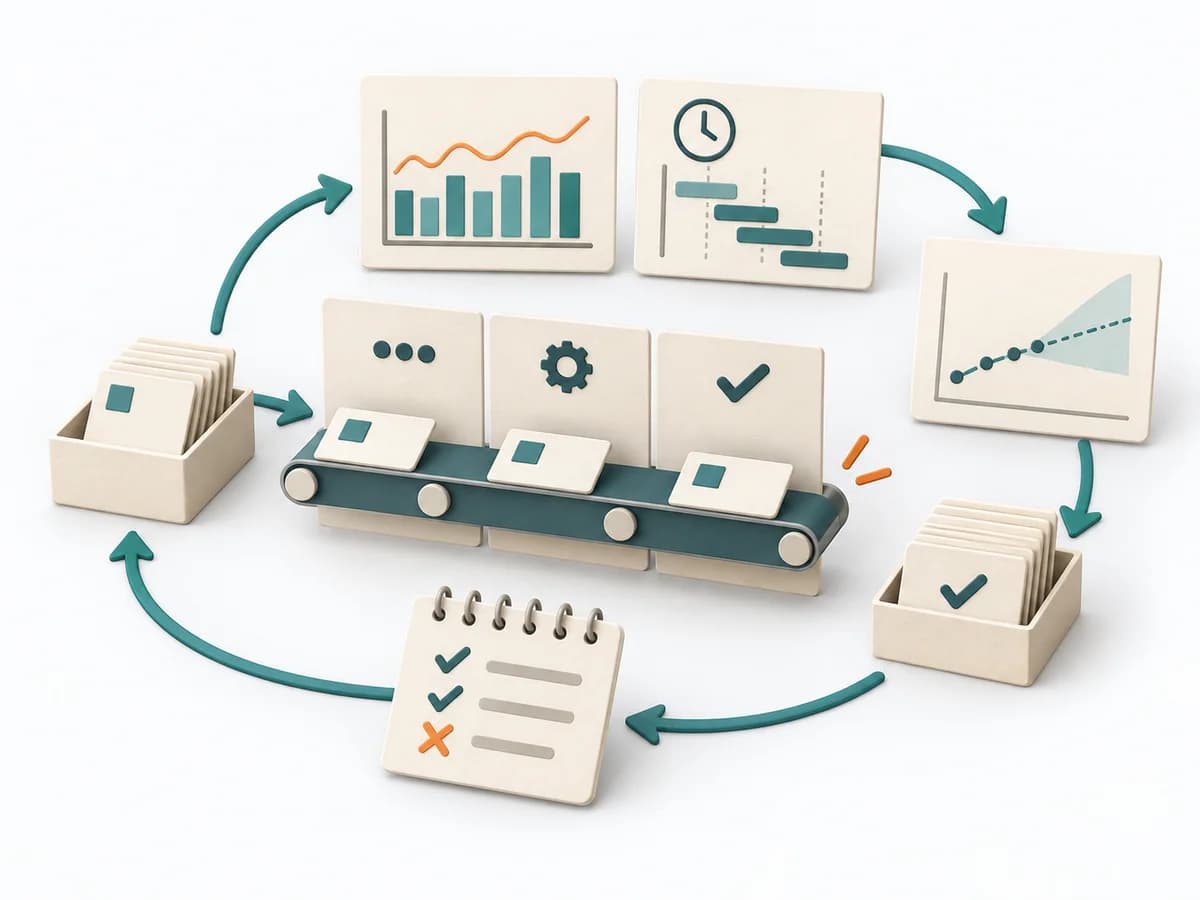
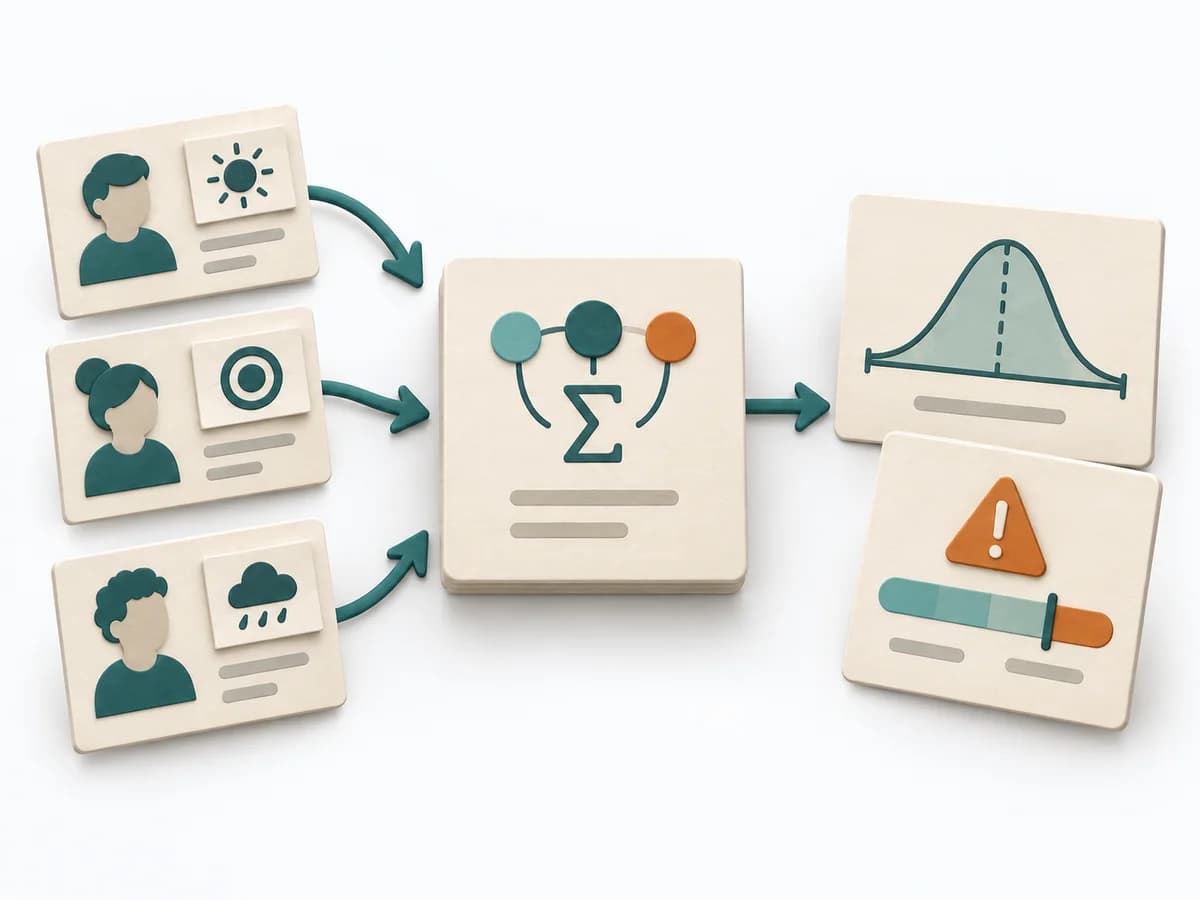
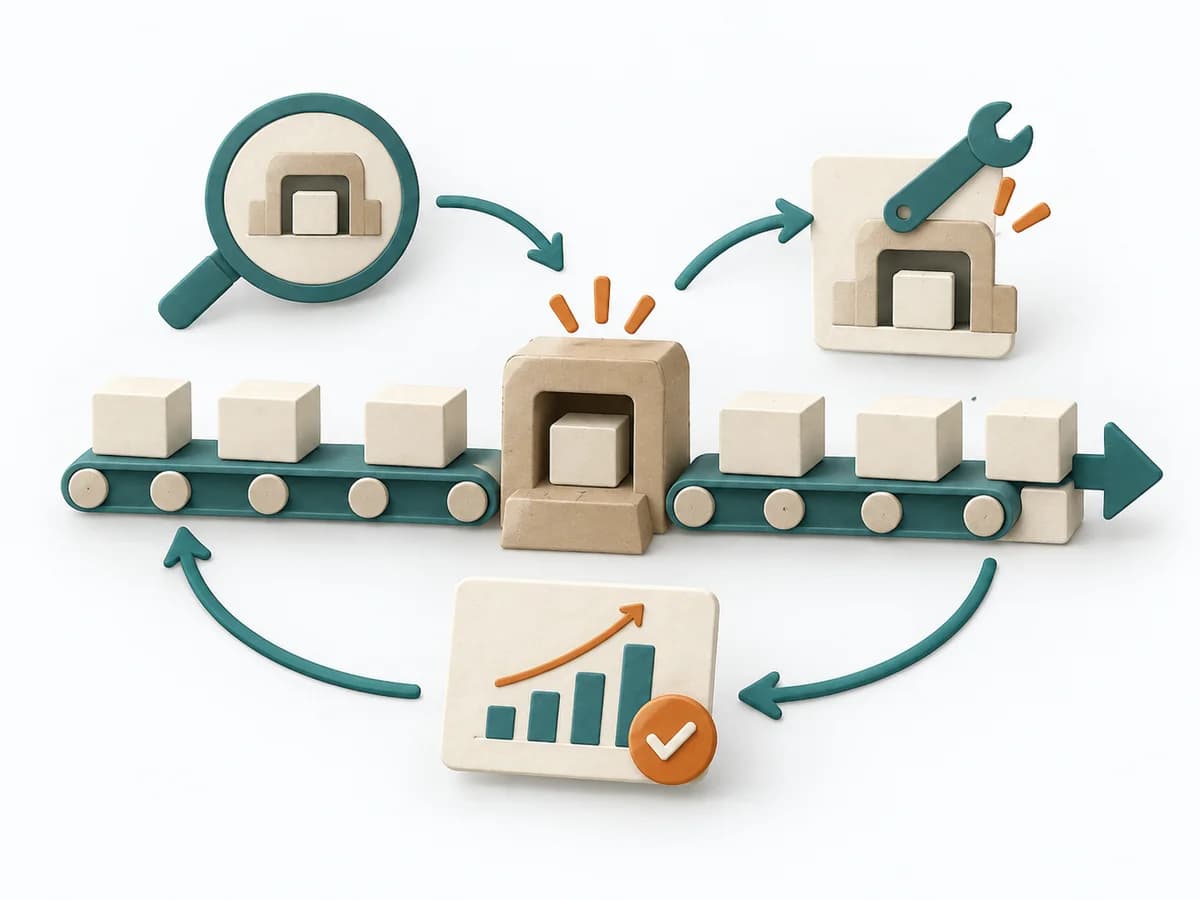
Purposedifferent | With high tempo and many parallel topics, the method makes status, deviations, and priorities visible at a glance. It reduces search effort and prevents what matters from getting lost in daily work. | A single estimate for effort, time, or risk often looks too smooth for the real uncertainty behind it. It separates options, evaluation criteria, and open risks. The result is captured as a Three-Point Estimate, Risk Range, and Assumption Notes. | When work sits in too many parallel streams, throughput suffers and no one sees the bottlenecks. Kanban makes the flow of work visible and limits overload so a system becomes calmer and more predictable. |
Complexitydifferent | Low | Medium | Medium |
Timedifferent | Ongoing | 10-30 min je Item | Ongoing |
Participantsdifferent | 1-20 | 1-8 | 2-12 |
Formatsame | Workshop + async | Workshop + async | Workshop + async |
Outputdifferent | Visual Board, Status Indicators, Exception Cues | Three-Point Estimate, Risk Range, Assumption Notes | Kanban board, WIP policies, Flow metrics |
Tagsno overlap | SignalsOperationsVisual management | EstimationUncertaintyForecasting | FlowVisual managementDelivery |
Often compared together
Methods with strong topical overlap with the current selection, not yet in the comparison.