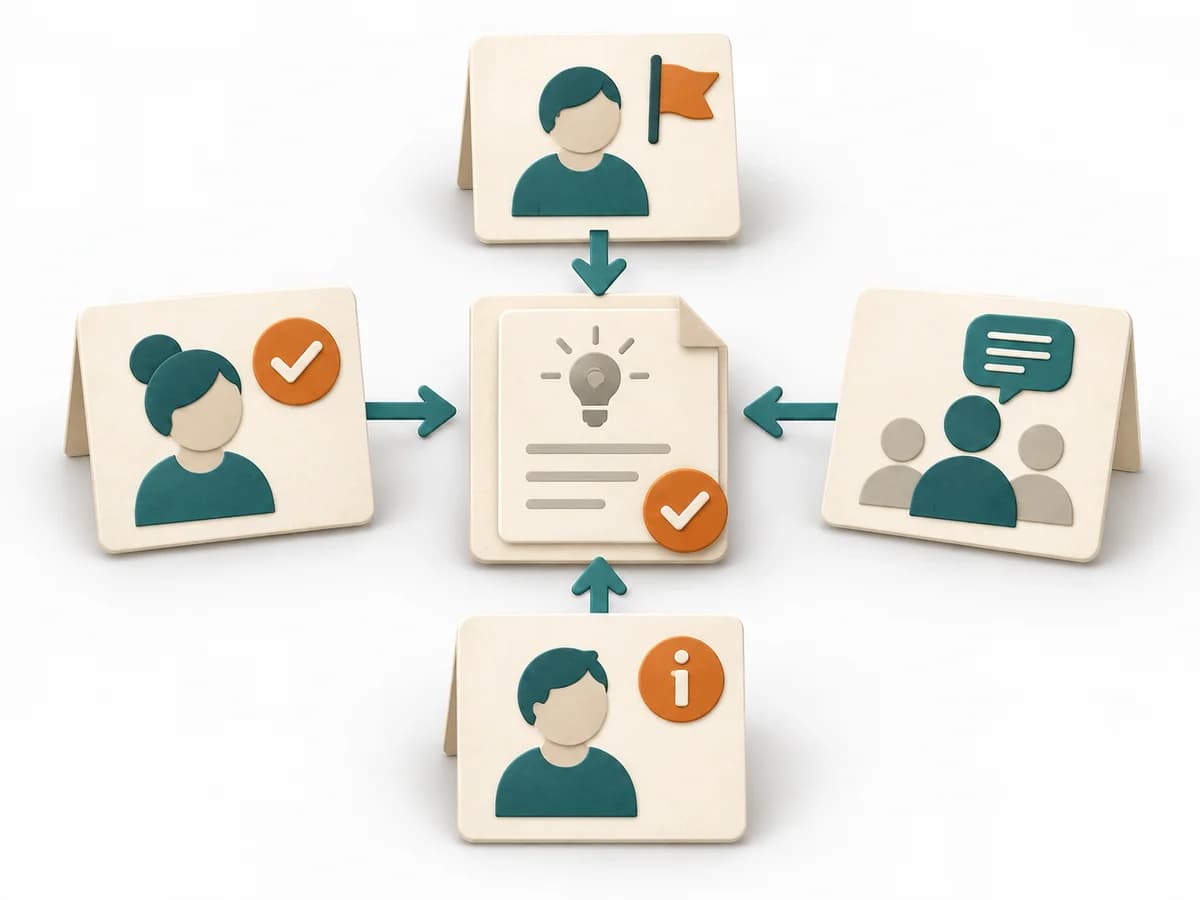
View methods side by side.
Choose up to four methods. Add them using the search and share the comparison by copying its link.
| Criterion |  Facilitation Timeline |  Growth North Star Metric |  Facilitation Decision Jam |
|---|---|---|---|
Purposedifferent | When a project, incident, or change process is only remembered in fragments, Timeline brings the sequence back into a readable form. It makes turning points, precursors, and after-effects recognizable over the course of time. | When product teams track many metrics, the view of the actual customer outcome easily gets lost. A North Star Metric bundles growth, usage, and value contribution into one signal that makes the system's direction visible. | When a decision is stuck, Decision Jam loosens the knot through structured separation of problem, idea, and selection. The format creates movement without jumping prematurely at the first seemingly elegant answer. |
Complexitydifferent | Low | Medium | Low |
Timedifferent | 30-90 min | 1-2 h | 60-90 min |
Participantsdifferent | 2-12 | 3-8 | 4-10 |
Formatdifferent | Workshop + async | Workshop + async | Workshop |
Outputdifferent | Timeline, Milestones, Insight Notes | North Star metric, Input metric tree, Measurement cadence | Problem Cluster, Prioritized Challenge, Experiment |
Tagsno overlap | TimelineFacilitationSequence | GrowthMetricsAlignmentRetention | FacilitationDecisionProblem solvingWorkshop |
Often compared together
Methods with strong topical overlap with the current selection, not yet in the comparison.