View methods side by side.
Choose up to four methods. Add them using the search and share the comparison by copying its link.
| Criterion |  Facilitation 3-Circle Venn Diagram | 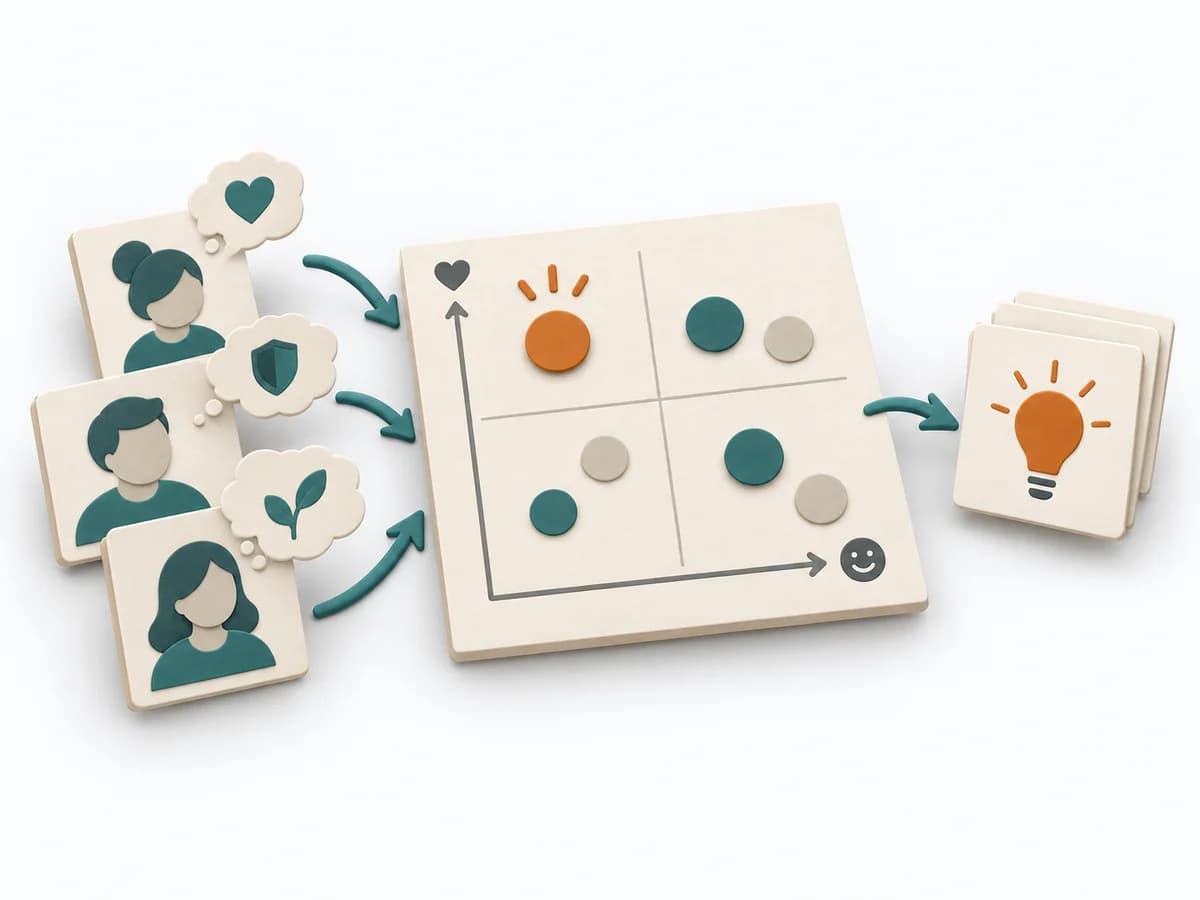 Product Discovery Outcome-Driven Innovation |  Facilitation Dot Voting |
|---|---|---|---|
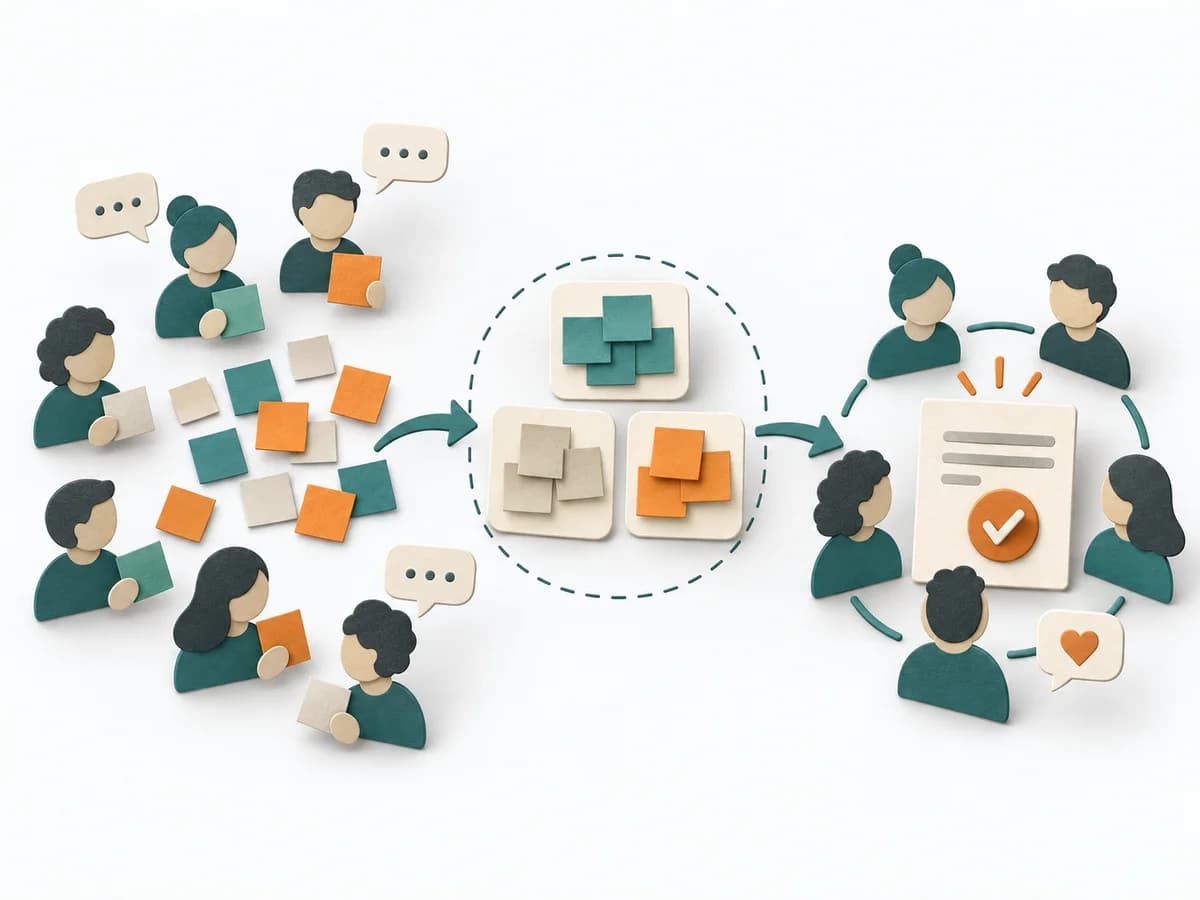
Purposedifferent | When three perspectives matter at the same time, a Three-Circle Venn Diagram shows the overlaps and remainders precisely. It makes visible where shared effect arises and where only a partial perspective applies. | Outcome-Driven Innovation clarifies customer problems, solution opportunities, and evidence. It separates jobs, desired outcomes, importance, satisfaction, and opportunity, and captures results as desired outcome statements, an opportunity landscape, and segments by underserved needs. | When a workshop has produced too many options and the group needs to condense quickly, dot voting makes preferences visible in a short time. It bundles individual votes into a solid signal for the next selection. |
Complexitydifferent | Low | High | Low |
Timedifferent | 15-45 min | Mehrere Wochen | 5-15 min |
Participantsdifferent | 2-8 | 2-6 researchers plus sample | 3-20 |
Formatdifferent | Workshop + async | Workshop + async | Workshop |
Outputdifferent | Venn Diagram, Overlap Notes, Differentiators | Desired outcome statements, Opportunity landscape, Segmentation by underserved needs, Innovation hypotheses | Ranked list, Consensus signal, Shortlist |
Tagsno overlap | ComparisonFacilitationAlignment | OutcomesInnovationResearchQuantitative | FacilitationVotingConsensusPrioritization |
Often compared together
Methods with strong topical overlap with the current selection, not yet in the comparison.