View methods side by side.
Choose up to four methods. Add them using the search and share the comparison by copying its link.
| Criterion | 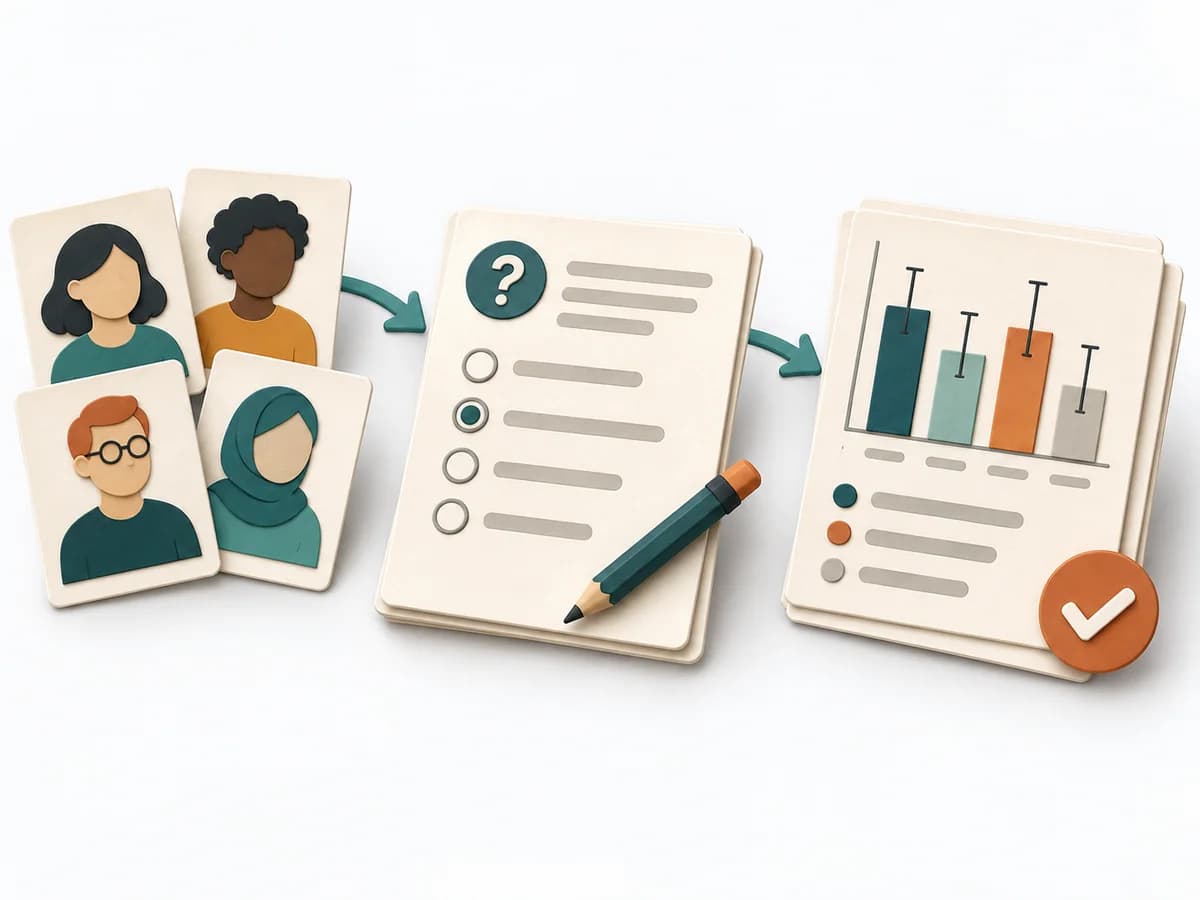 UX Research Surveys | 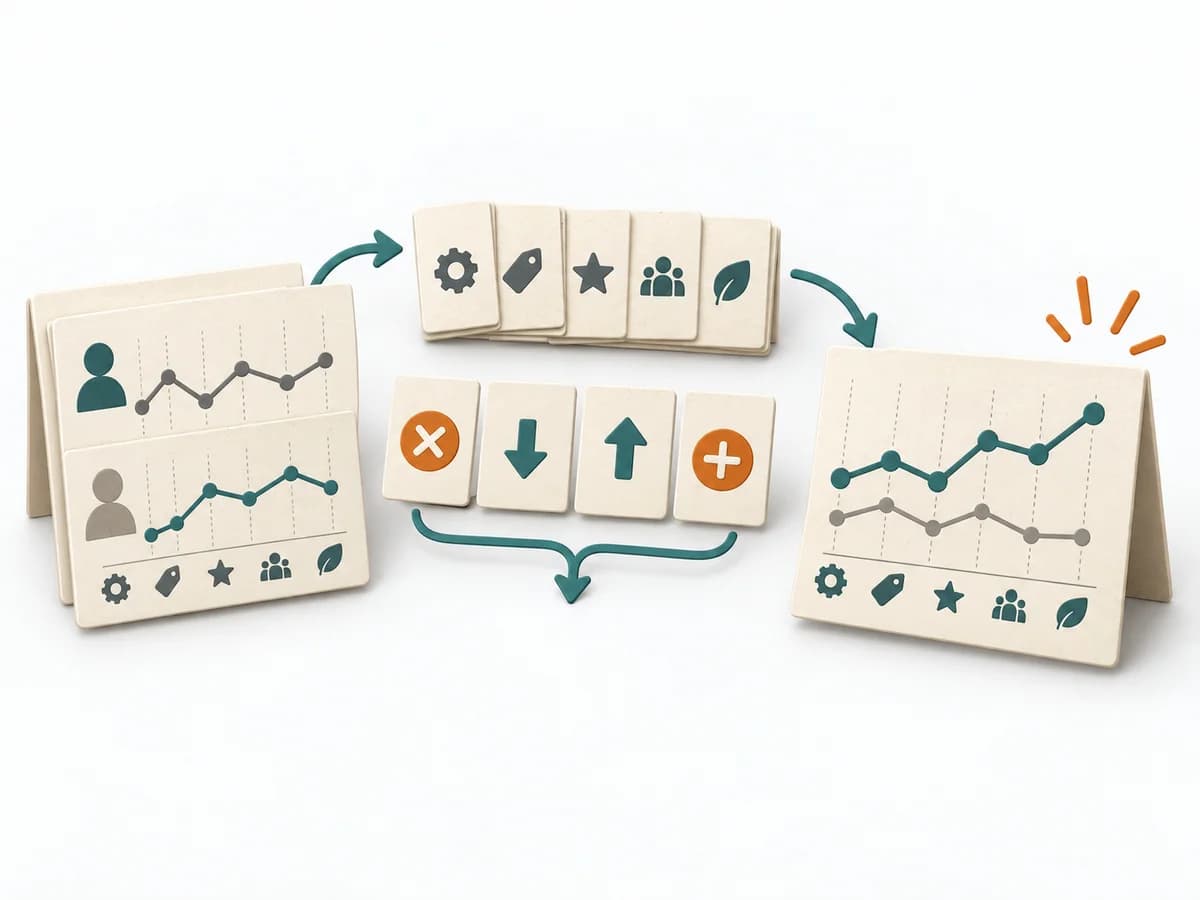 Business Strategy Blue Ocean Strategy Canvas |
|---|---|---|
Purposedifferent | When a topic needs to be validated broadly and many people can answer the same question, surveys gather structured feedback in a scalable form. Answers become comparable and segmentable instead of remaining merely anecdotal. | The Blue Ocean Strategy Canvas shows how an offering is positioned relative to the market. Differentiation thereby becomes tangible in value factors instead of merely being claimed. |
Complexitysame | Medium | Medium |
Timedifferent | 3-14 Tage | 2-4 h |
Participantsdifferent | 50+ | 3-10 |
Formatdifferent | Async | Workshop |
Outputdifferent | Survey Results, Charts, Segment Insights | Strategy Canvas, Value Curve, ERRC Actions |
Tagsno overlap | QuantitativeResearchValidation | StrategyPositioningInnovationValue |
Often compared together
Methods with strong topical overlap with the current selection, not yet in the comparison.