View methods side by side.
Choose up to four methods. Add them using the search and share the comparison by copying its link.
Selected:Strategy Execution LoopBehavior Over Time GraphStrategic, Tactical and Operational Planning
| Criterion |  Business Strategy Strategy Execution Loop |  Systems Thinking Behavior Over Time Graph | 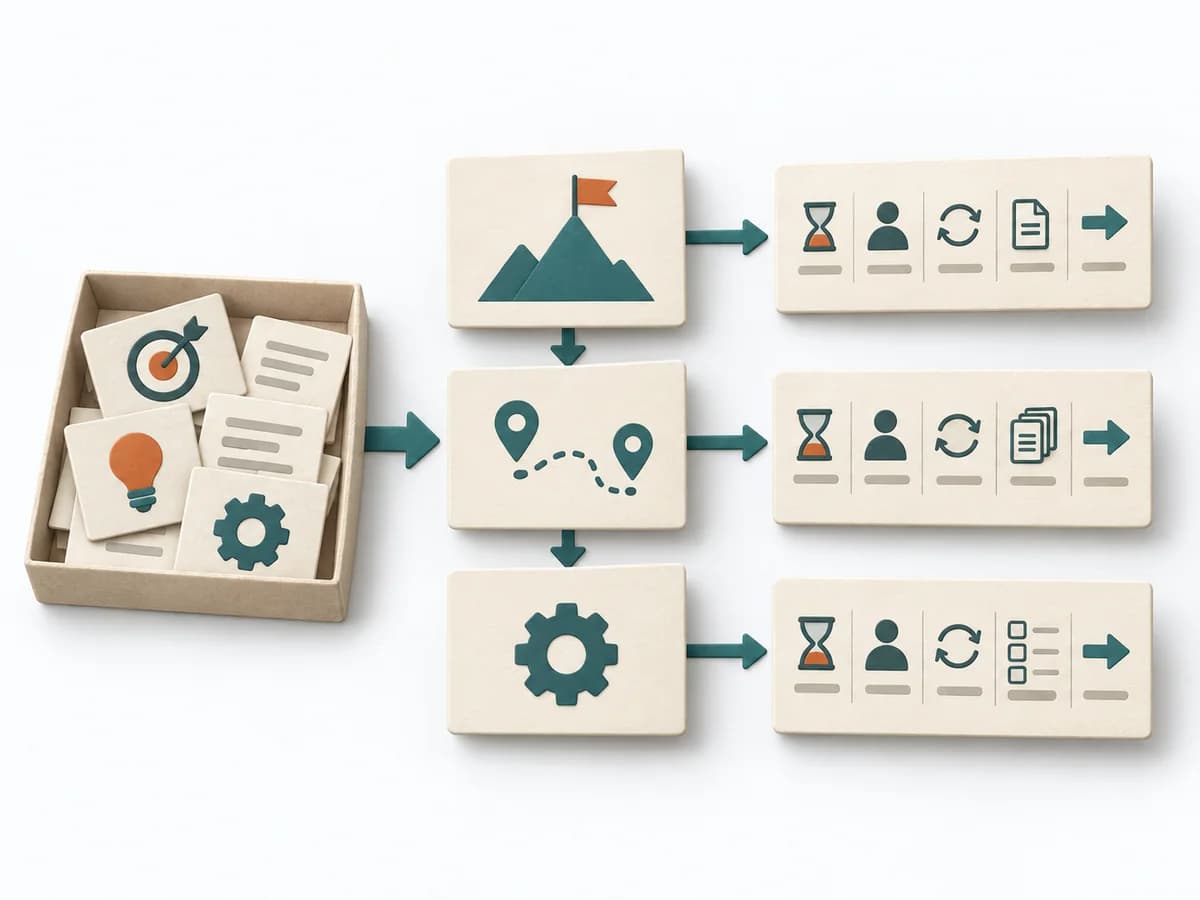 Business Strategy Strategic, Tactical and Operational Planning |
|---|---|---|---|
Purposedifferent | The Strategy Execution Loop helps avoid treating strategy as a one-off document. It makes visible how strategic decisions are turned into objectives, initiatives, operational work, measurement, and learning. | A Behavior Over Time Graph shows how a metric or observation develops over time. The method makes trends, breaks, and recurring patterns visible that get lost in snapshots. | It places decisions and artifacts at the right level. Strategic planning clarifies direction, tactical planning translates it into programs, and operational planning steers concrete processes. |
Complexitydifferent | High | Low | Medium |
Timedifferent | Initial 3-6 h, then monthly or quarterly reviews | 20-45 min | 90-180 min |
Participantsdifferent | 5-12 | 1-10 | 4-12 |
Formatdifferent | Workshop + async | Workshop + async | Workshop |
Outputdifferent | Execution Loop, Review Cadence, Strategic Learning Log | Behavior Over Time Graph, Trend Hypotheses, Key Events | Planning Levels Map, Cadence Model, Planning Artifact Inventory |
Tagsno overlap | ExecutionCadenceLearningGovernance | Systems thinkingPatternsDynamics | CadenceGovernanceExecution |
Often compared together
Methods with strong topical overlap with the current selection, not yet in the comparison.



