View methods side by side.
Choose up to four methods. Add them using the search and share the comparison by copying its link.
| Criterion |  UX Design Storyboarding | 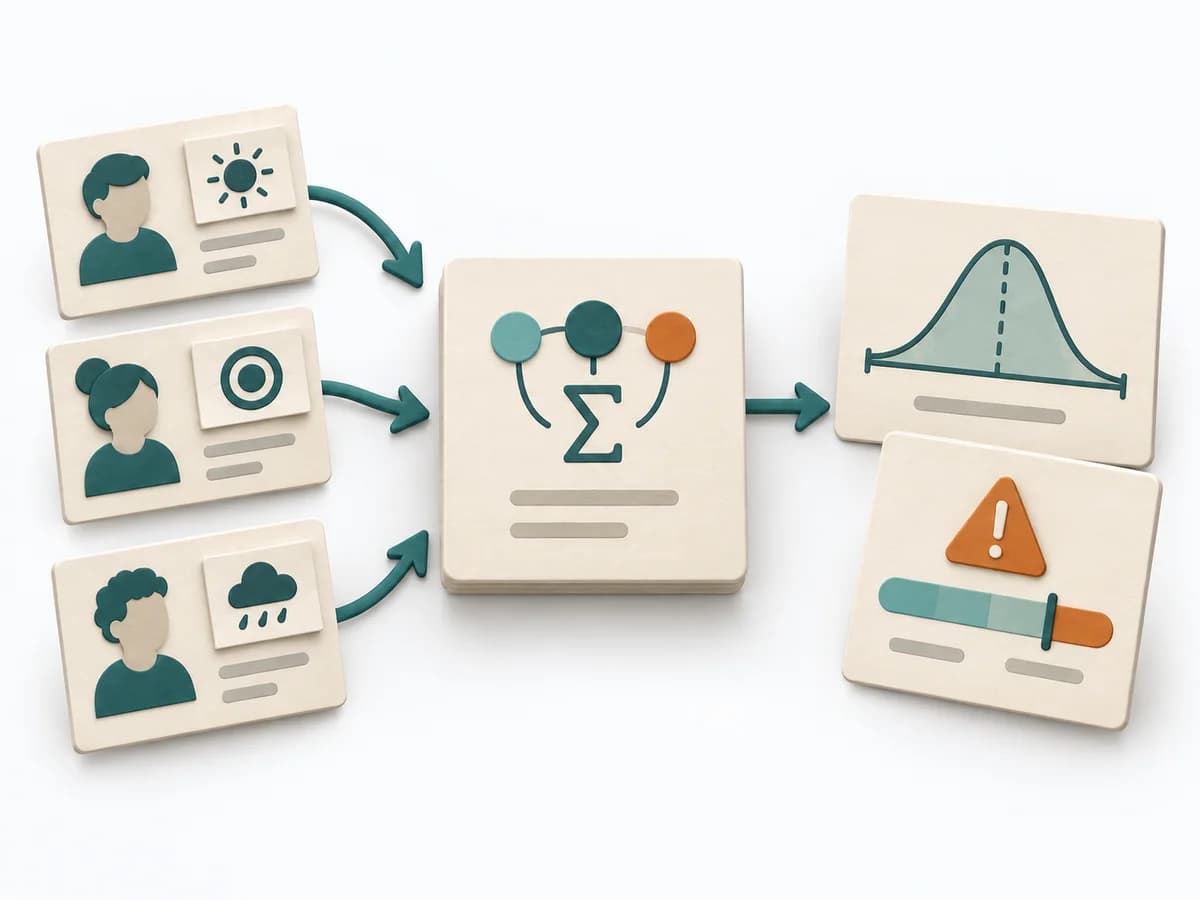 Decision Making PERT Estimation |
|---|---|---|
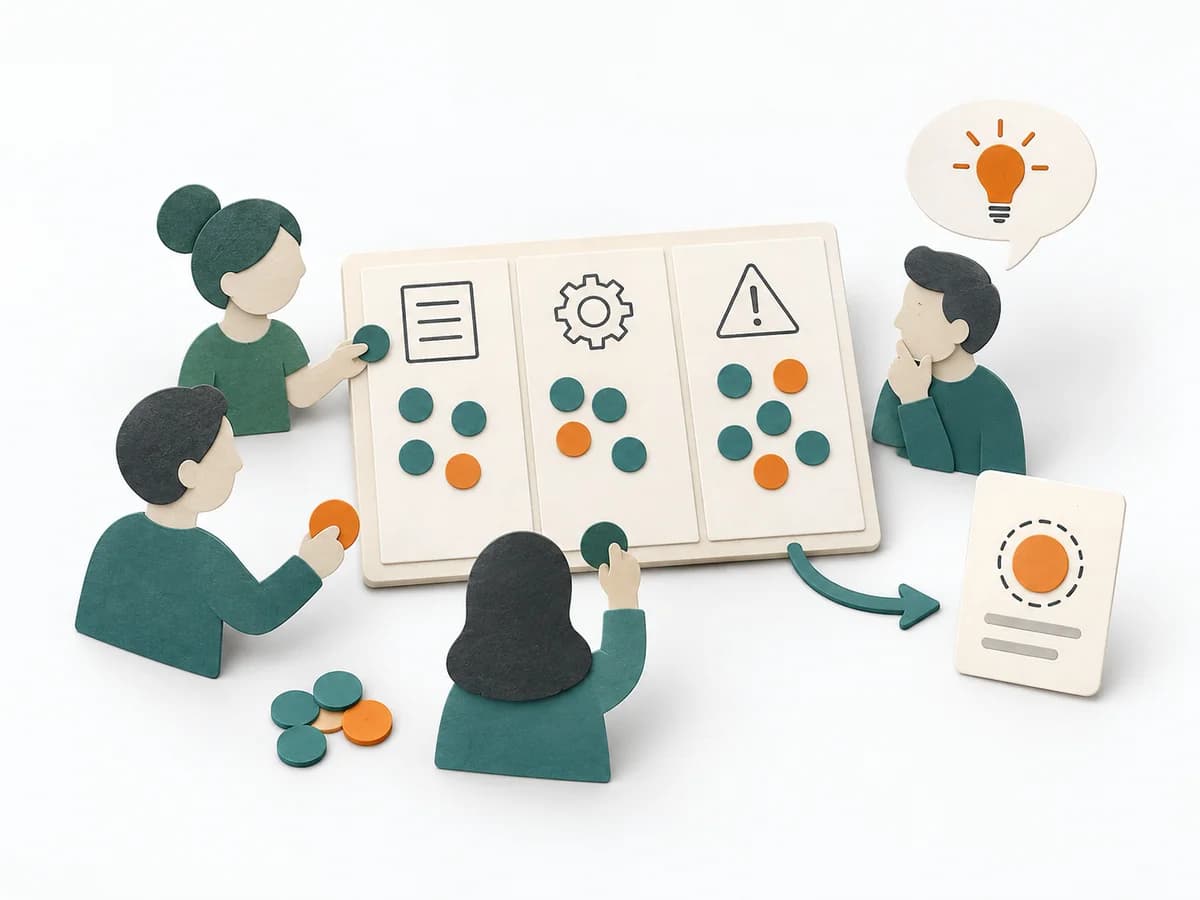
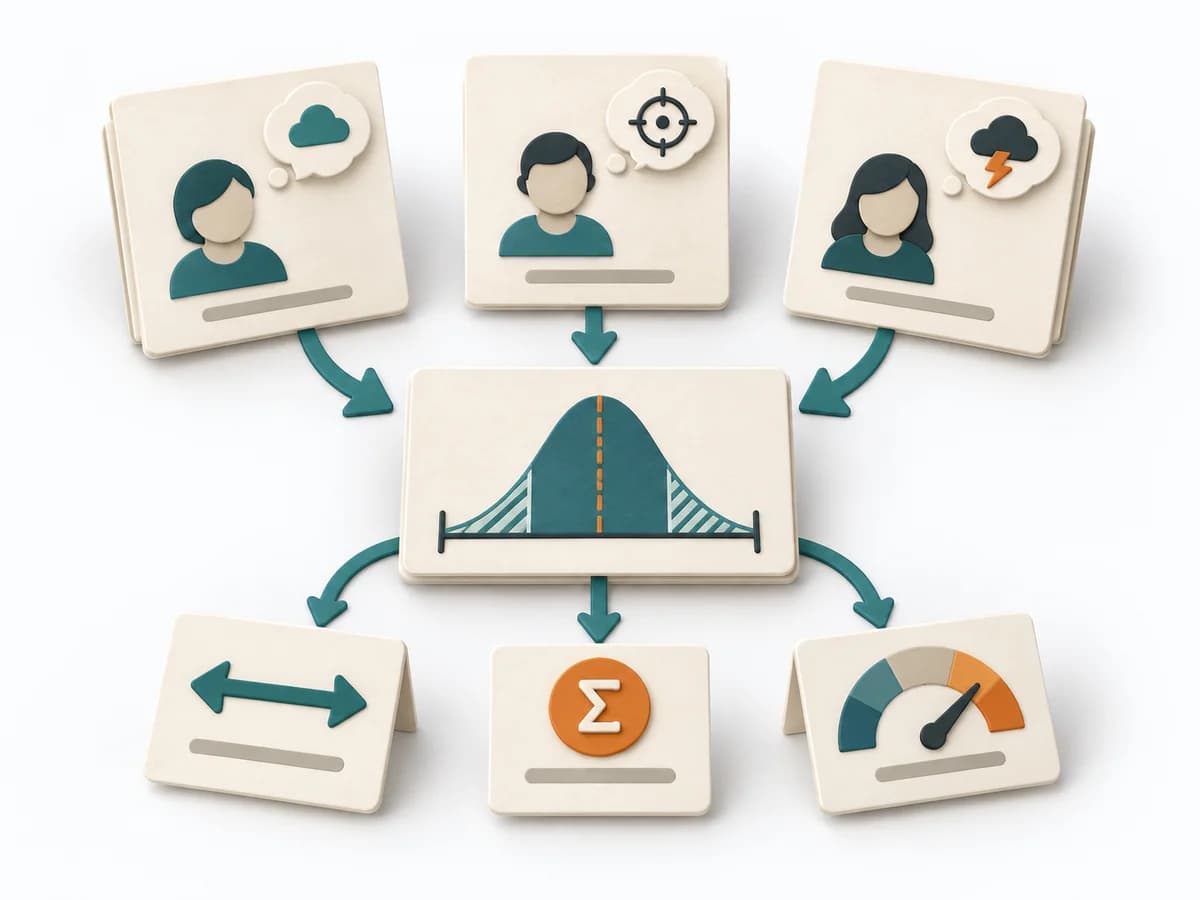
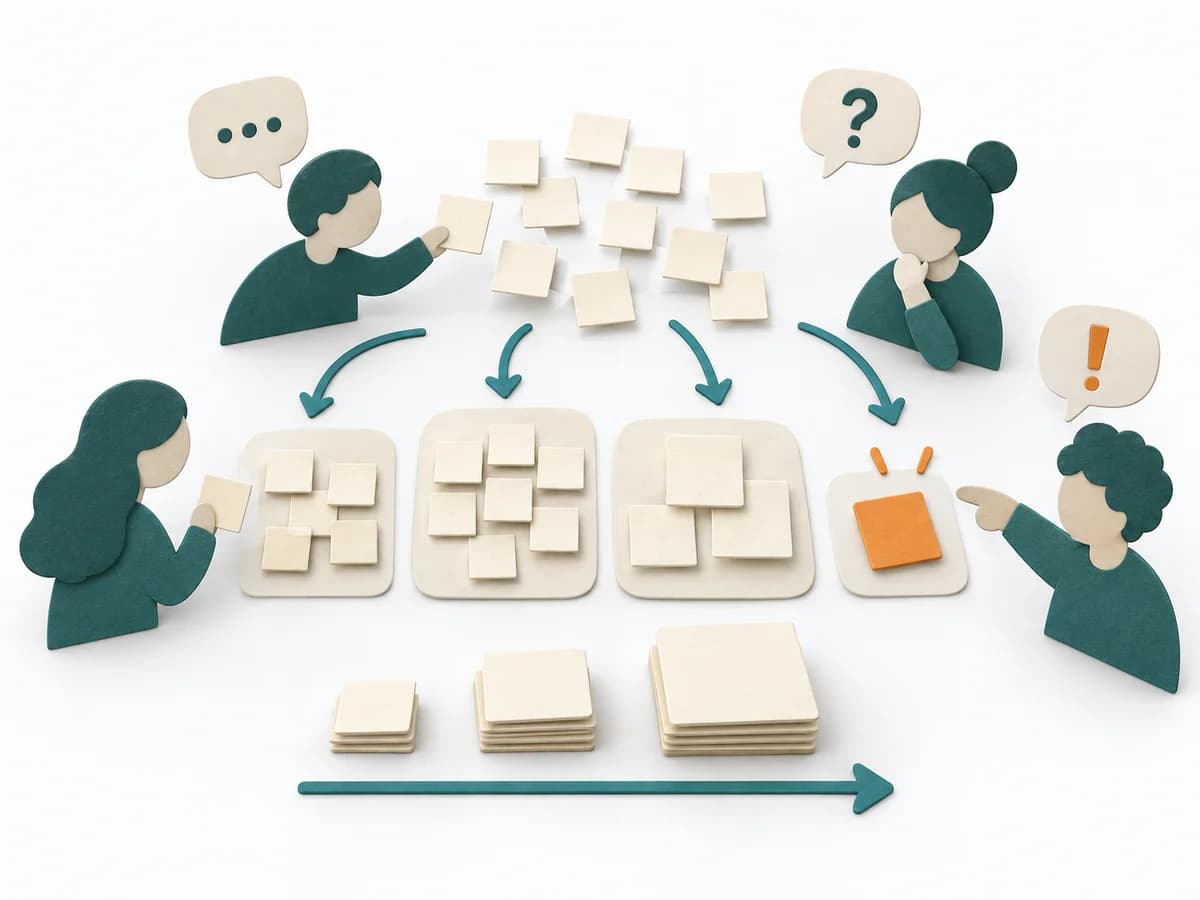
Purposedifferent | When a usage scenario needs to become understandable early, it condenses situations, context, and flow into a legible sequence. It helps check concept ideas before anything gets built. | On complex initiatives, a plain average tends to understate just how uncertain the outcome really is. It separates options, evaluation criteria, and open risks. The result is captured as a PERT Estimate, Expected Value, and Risk Notes. |
Complexitysame | Medium | Medium |
Timedifferent | 30-90 min | 15-45 min |
Participantssame | 1-8 | 1-8 |
Formatsame | Workshop + async | Workshop + async |
Outputdifferent | Storyboard, Concept Narrative, Testable Assumptions | PERT Estimate, Expected Value, Risk Notes |
Tagsno overlap | VisualizationConceptsSequencePrototype | EstimationUncertaintyRisk |
Often compared together
Methods with strong topical overlap with the current selection, not yet in the comparison.