View methods side by side.
Choose up to four methods. Add them using the search and share the comparison by copying its link.
| Criterion |  Systems Thinking Stock and Flow Diagram | 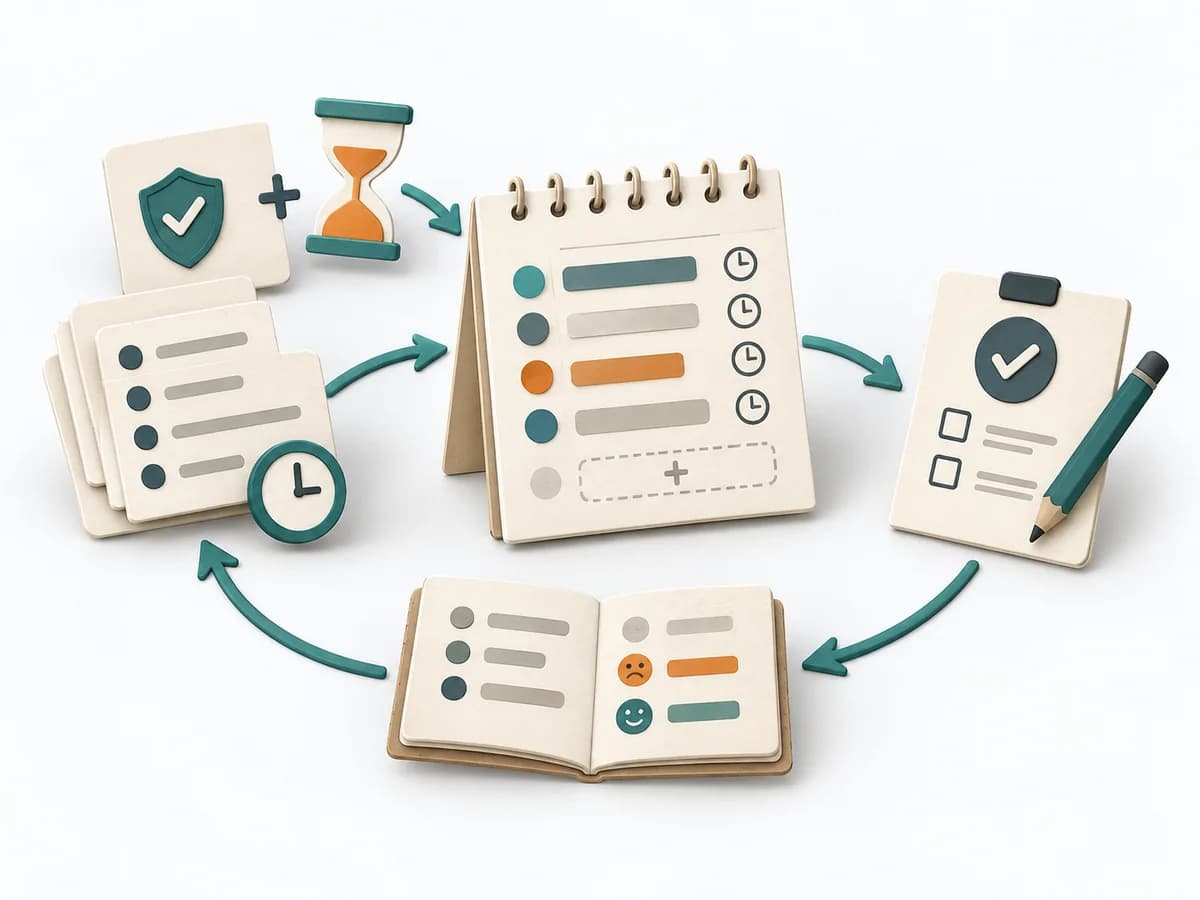 Operations ALPEN Method |  Business Strategy GAP Analysis |
|---|---|---|---|
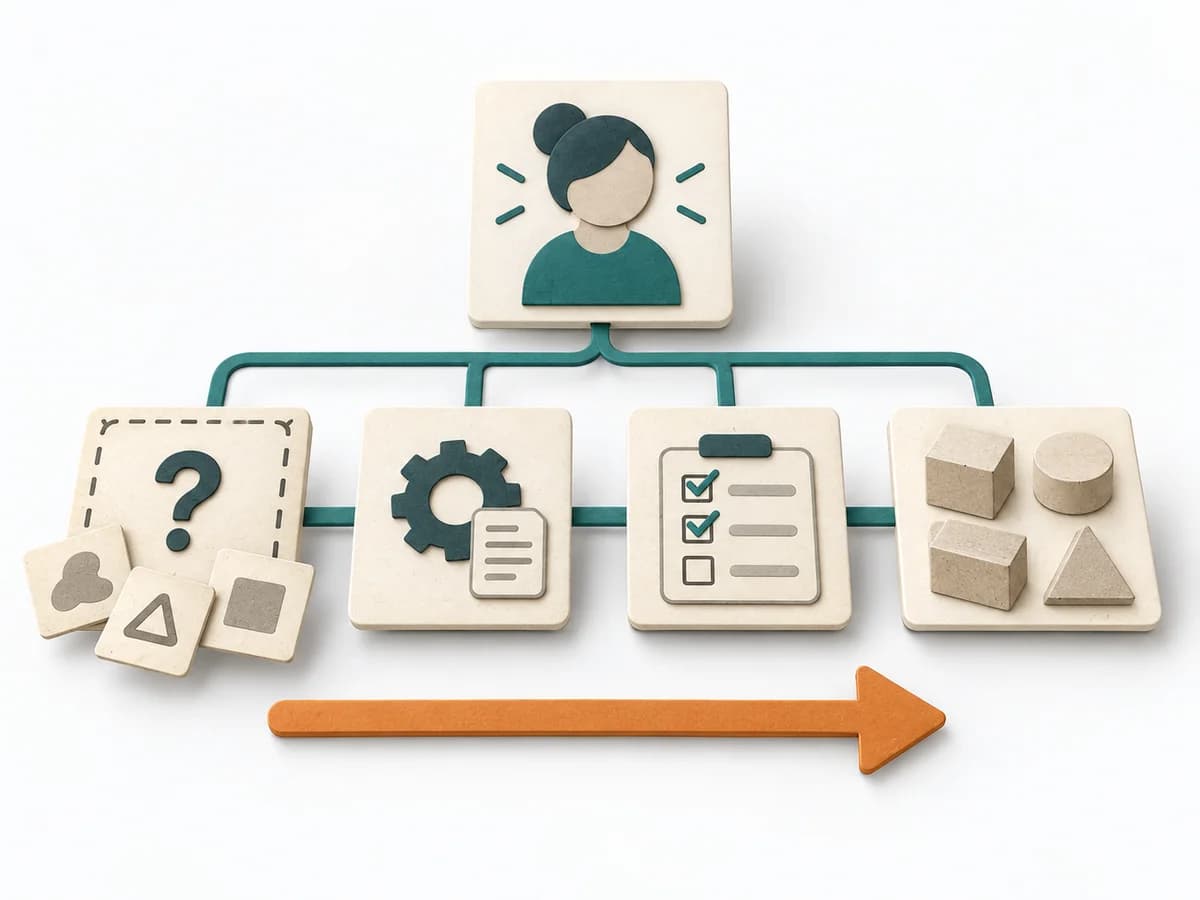
Purposedifferent | A Stock and Flow Diagram shows how stocks, inflows, and outflows shape a system over time. It is especially suited when growth, delays, or capacity limits determine the dynamics. | With an overloaded day full of too many tasks, a realistic picture of the day emerges. The method connects estimating, deciding, and buffer thinking so planning fits available energy and time. | GAP Analysis compares the current state with a target picture and makes the distance manageable. It becomes useful when, ahead of new initiatives, it must become clear which capabilities, processes, or resources are missing. |
Complexitydifferent | High | Low | Medium |
Timedifferent | 2-6 h | 10-20 min daily | 1-3 h |
Participantsdifferent | 1-6 | 1 | 2-8 |
Formatdifferent | Workshop + async | Async | Workshop + async |
Outputdifferent | Stock and Flow Model, Dynamics Notes, Simulation Hypotheses | Daily Plan, Time Estimates, Review Notes | Gap Matrix, Action Plan, Risk Notes |
Tagsno overlap | DynamicsSimulationFeedbackSystems thinking | PlanningTime managementProductivityOperations | StrategyAnalysisPlanning |
Often compared together
Methods with strong topical overlap with the current selection, not yet in the comparison.