View methods side by side.
Choose up to four methods. Add them using the search and share the comparison by copying its link.
| Criterion | 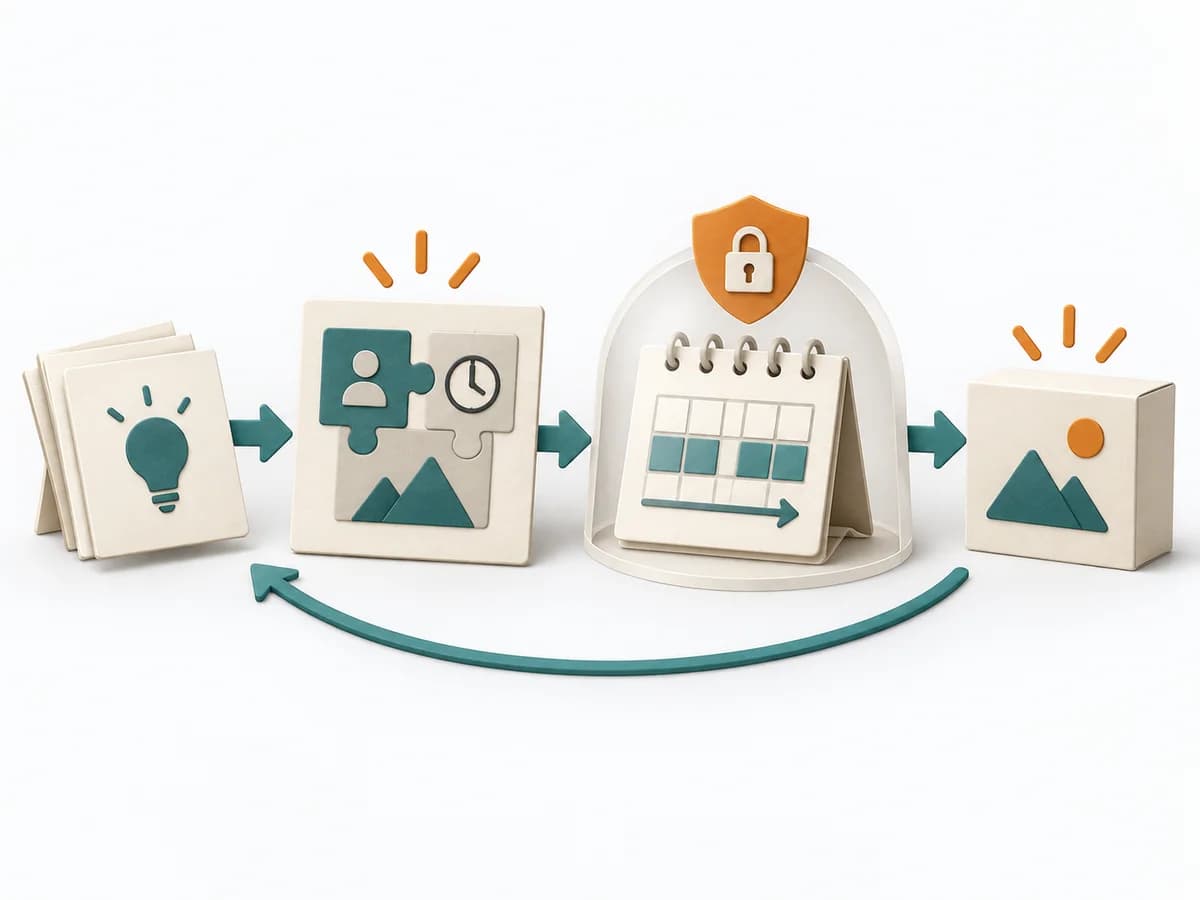 Delivery Shape Up |  Operations ALPEN Method |  Systems Thinking Behavior Over Time Graph |
|---|---|---|---|
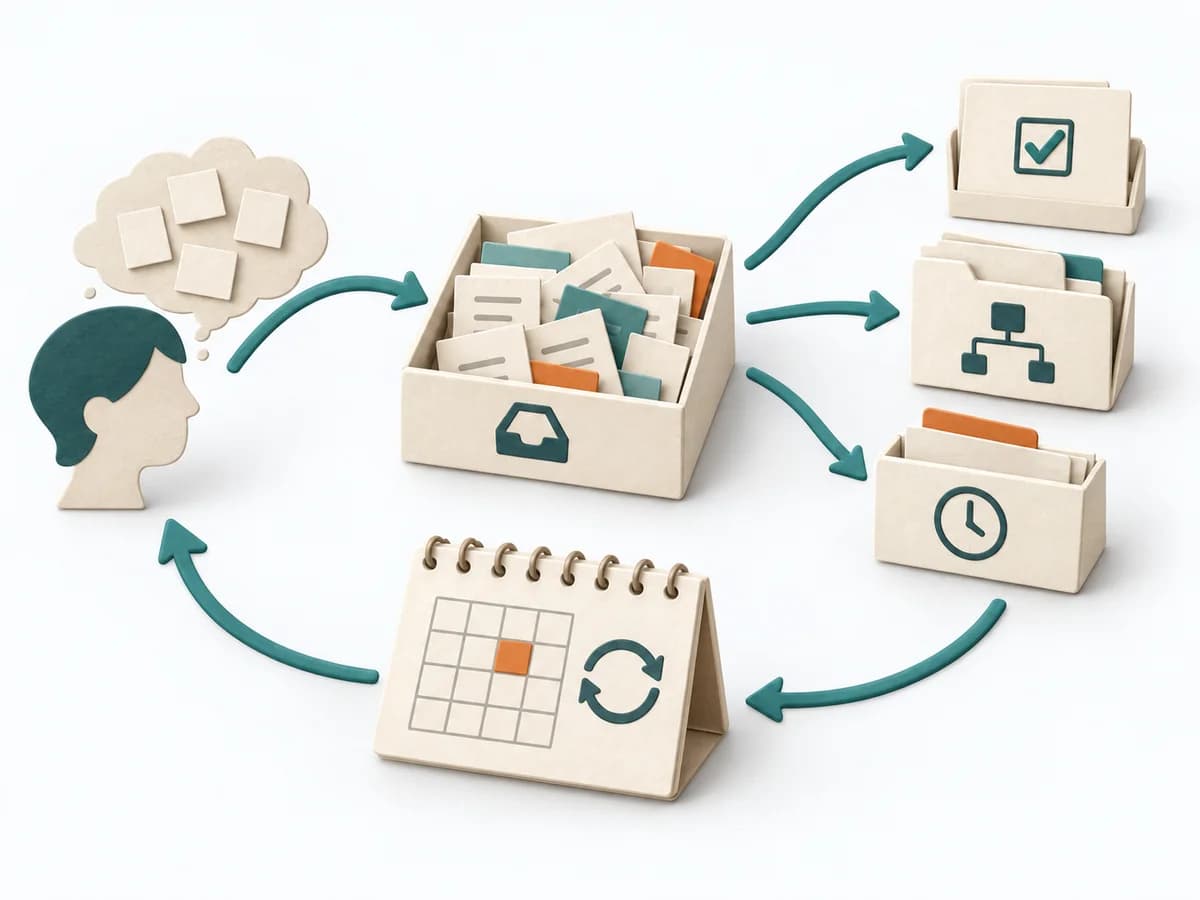
Purposedifferent | Shape Up helps clarify scope, sequence, and delivery flow. It makes work boundaries and decisions explicit and captures results as pitches, bet-table decisions, and hill charts. | With an overloaded day full of too many tasks, a realistic picture of the day emerges. The method connects estimating, deciding, and buffer thinking so planning fits available energy and time. | A Behavior Over Time Graph shows how a metric or observation develops over time. The method makes trends, breaks, and recurring patterns visible that get lost in snapshots. |
Complexitydifferent | Medium | Low | Low |
Timedifferent | 6 Wochen Cycle + 2 Wochen Cool-Down | 10-20 min daily | 20-45 min |
Participantsdifferent | 2-4 pro Pitch | 1 | 1-10 |
Formatdifferent | Workshop + async | Async | Workshop + async |
Outputdifferent | Pitches, Bet-table decisions, Hill charts, Cooldown outcomes | Daily Plan, Time Estimates, Review Notes | Behavior Over Time Graph, Trend Hypotheses, Key Events |
Tagsno overlap | PlanningDeliveryAutonomy | PlanningTime managementProductivityOperations | Systems thinkingPatternsDynamics |
Often compared together
Methods with strong topical overlap with the current selection, not yet in the comparison.