View methods side by side.
Choose up to four methods. Add them using the search and share the comparison by copying its link.
| Criterion | 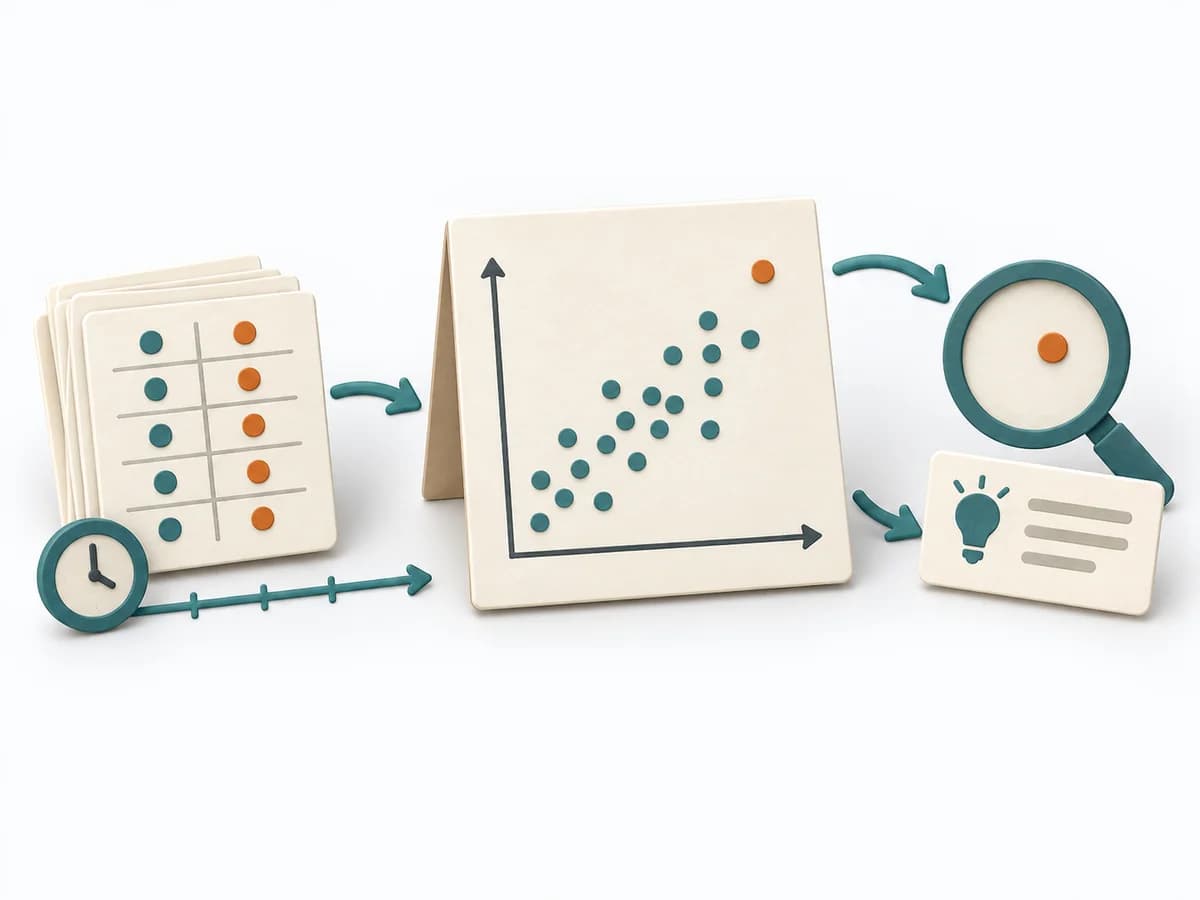 Operations Scatter Diagram | 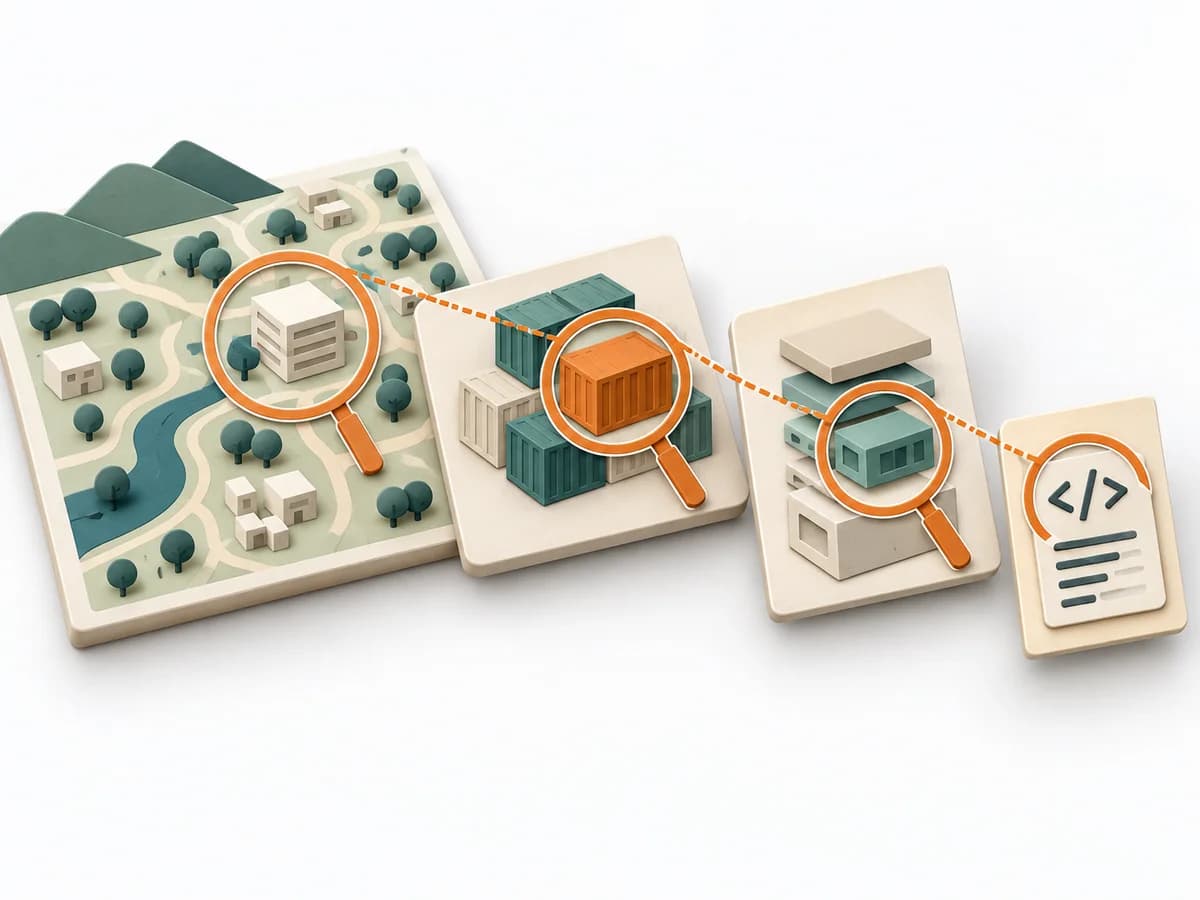 Architecture C4 Model |
|---|---|---|
Purposedifferent | When the question is whether two measures are related, the method makes patterns in the data picture visible. It separates felt correlations from relationships that actually show up in the data. | The C4 Model makes a system legible across several resolution levels, from context down to code. It suits situations where different audiences need to understand the same architecture from different altitudes. |
Complexitysame | Low | Low |
Timedifferent | 30-90 min | 1-4 h |
Participantsdifferent | 1-4 | 1-5 |
Formatsame | Workshop + async | Workshop + async |
Outputdifferent | Scatter Plot, Korrelationsnotiz, Hypothesenliste | Context Diagram, Container Diagram, Component Diagram |
Tags1 shared | Root causeQualityVisualization | ArchitectureCommunicationVisualization |
Often compared together
Methods with strong topical overlap with the current selection, not yet in the comparison.