View methods side by side.
Choose up to four methods. Add them using the search and share the comparison by copying its link.
| Criterion | 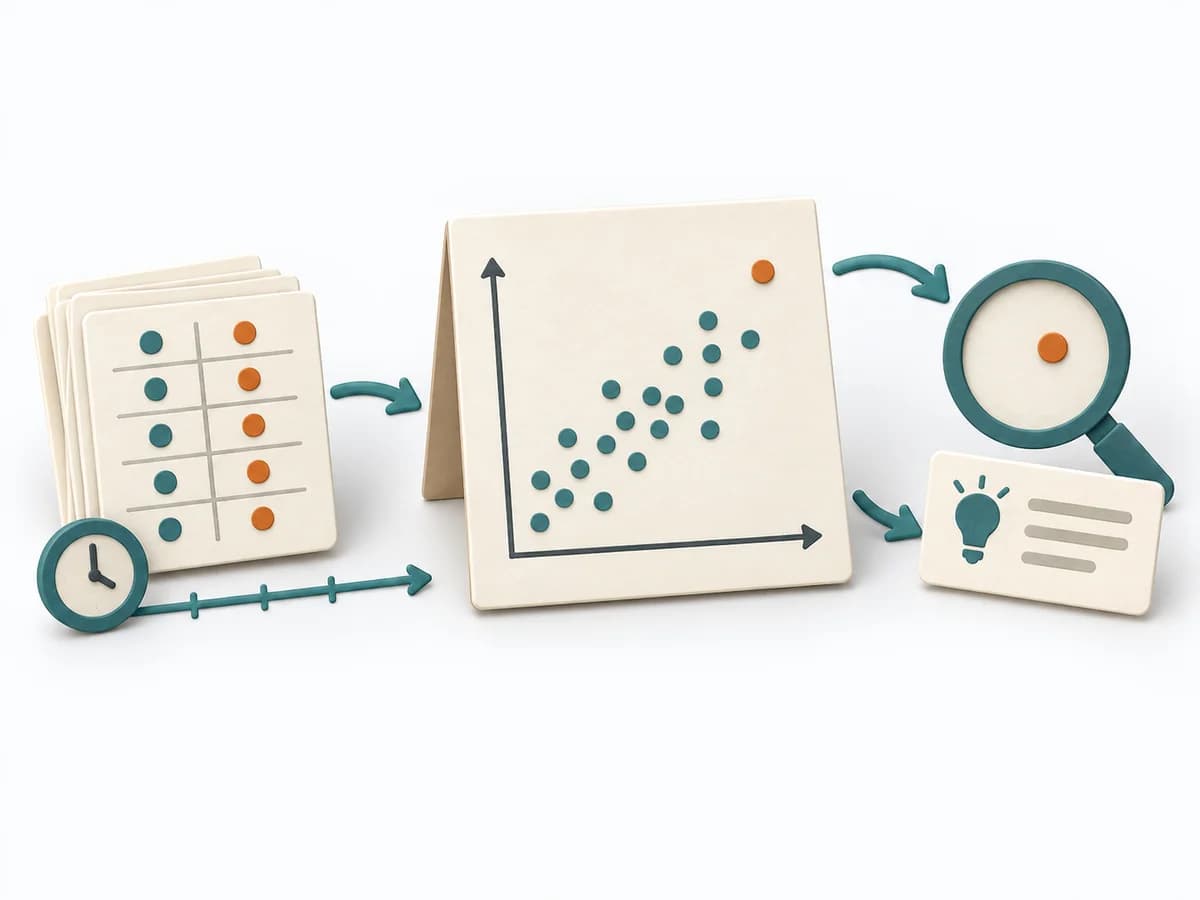 Operations Scatter Diagram |  Operations A3 Problem Solving |  Operations 5 Whys |
|---|---|---|---|
Purposedifferent | When the question is whether two measures are related, the method makes patterns in the data picture visible. It separates felt correlations from relationships that actually show up in the data. | For a complex deviation with several people involved, the method bundles problem, analysis, and decision onto one page. It creates a shared working space where causes, countermeasures, and follow-up fit together. | For a single, hard-to-explain deviation, the method exposes the causal chain behind the visible symptom. It keeps the cause open until a controllable condition emerges instead of a mere description. |
Complexitydifferent | Low | Medium | Low |
Timedifferent | 30-90 min | 45-90 min | 15-30 min |
Participantsdifferent | 1-4 | 2-5 | 2-6 |
Formatdifferent | Workshop + async | Workshop + async | Workshop |
Outputdifferent | Scatter Plot, Korrelationsnotiz, Hypothesenliste | A3 Report, Action Plan, Root Cause Analysis | Root cause notes, Countermeasures |
Tagsno overlap | Root causeQualityVisualization | LeanProblem solvingCoachingOperations | Root causeIncidentLeanProblem solving |
Often compared together
Methods with strong topical overlap with the current selection, not yet in the comparison.



