View methods side by side.
Choose up to four methods. Add them using the search and share the comparison by copying its link.
| Criterion |  Architecture SAAM (Software Architecture Analysis Method) | 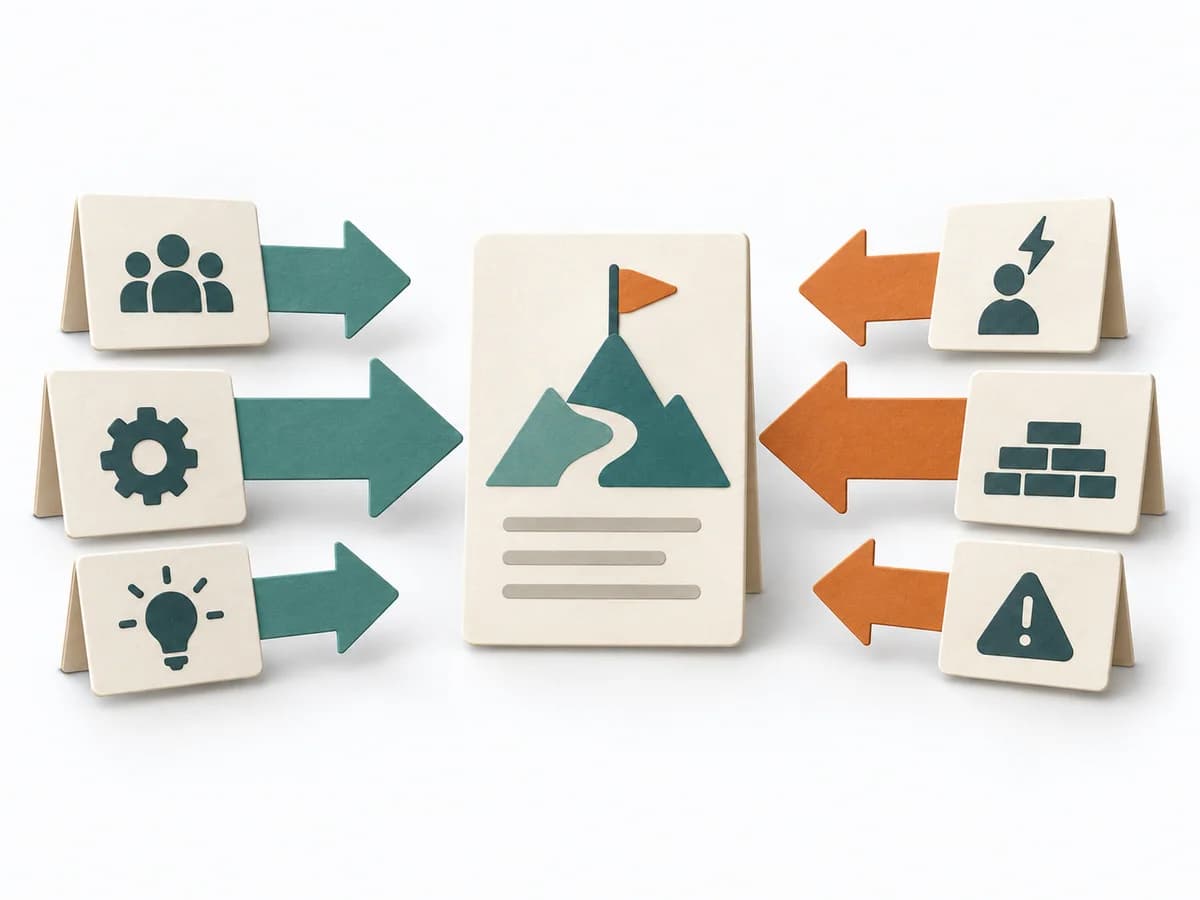 Decision Making Force Field Analysis | 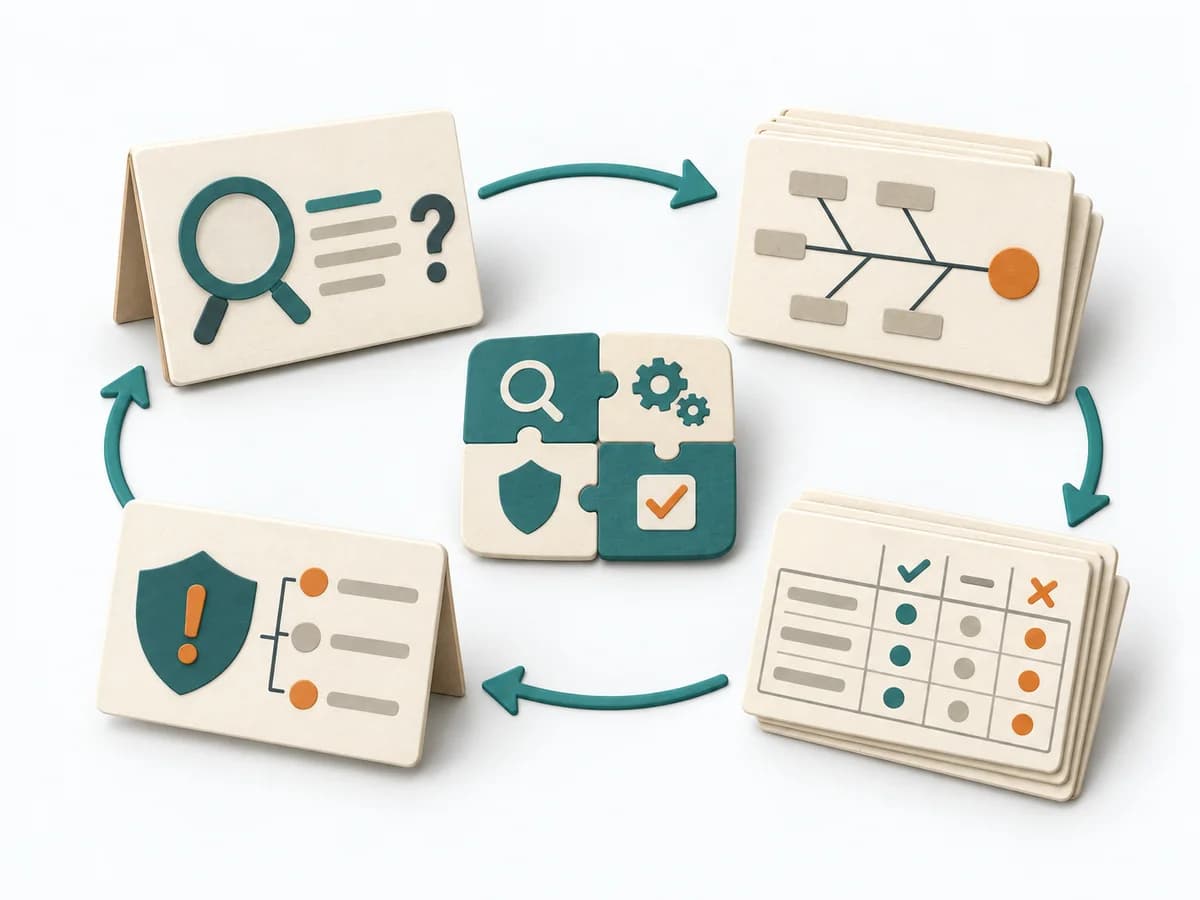 Operations Kepner-Tregoe |
|---|---|---|---|
Purposedifferent | SAAM helps teams judge an architecture’s suitability for selected tasks and changes. It is particularly useful for examining modifiability and comparing architecture alternatives with clear reasoning. | In change initiatives, supporting and restraining forces sit at the table at the same time. Force Field Analysis makes these tensions explicit and shows where change can be pushed forward by strengthening or relieving. | For a disturbance that's hard to pin down, the method cleanly separates problem, cause, and decision. It reduces mixing when symptoms allow several interpretations. |
Complexitydifferent | High | Low | High |
Timedifferent | Preparation, scenario analysis, and findings review; effort depends on scope | 45-90 min | 2-8 h |
Participantsdifferent | Architecture experts and stakeholders for scenarios and weighting | 3-12 | 2-8 |
Formatdifferent | Workshop + async | Workshop | Workshop + async |
Outputdifferent | Domain functions mapped to components and connections, Quality attributes and evaluation criteria, Typical tasks and their effects on the architecture, Reasoned evaluation or comparison of alternatives | Force Field Map, Change Levers, Risk Notes | Problem Analysis, Decision Analysis, Risk Plan |
Tagsno overlap | ArchitectureChangeAnalysisComparisonQuality | ChangeDecisionStrategy | Problem solvingRoot causeDecisionOperations |
Often compared together
Methods with strong topical overlap with the current selection, not yet in the comparison.



