View methods side by side.
Choose up to four methods. Add them using the search and share the comparison by copying its link.
| Criterion | 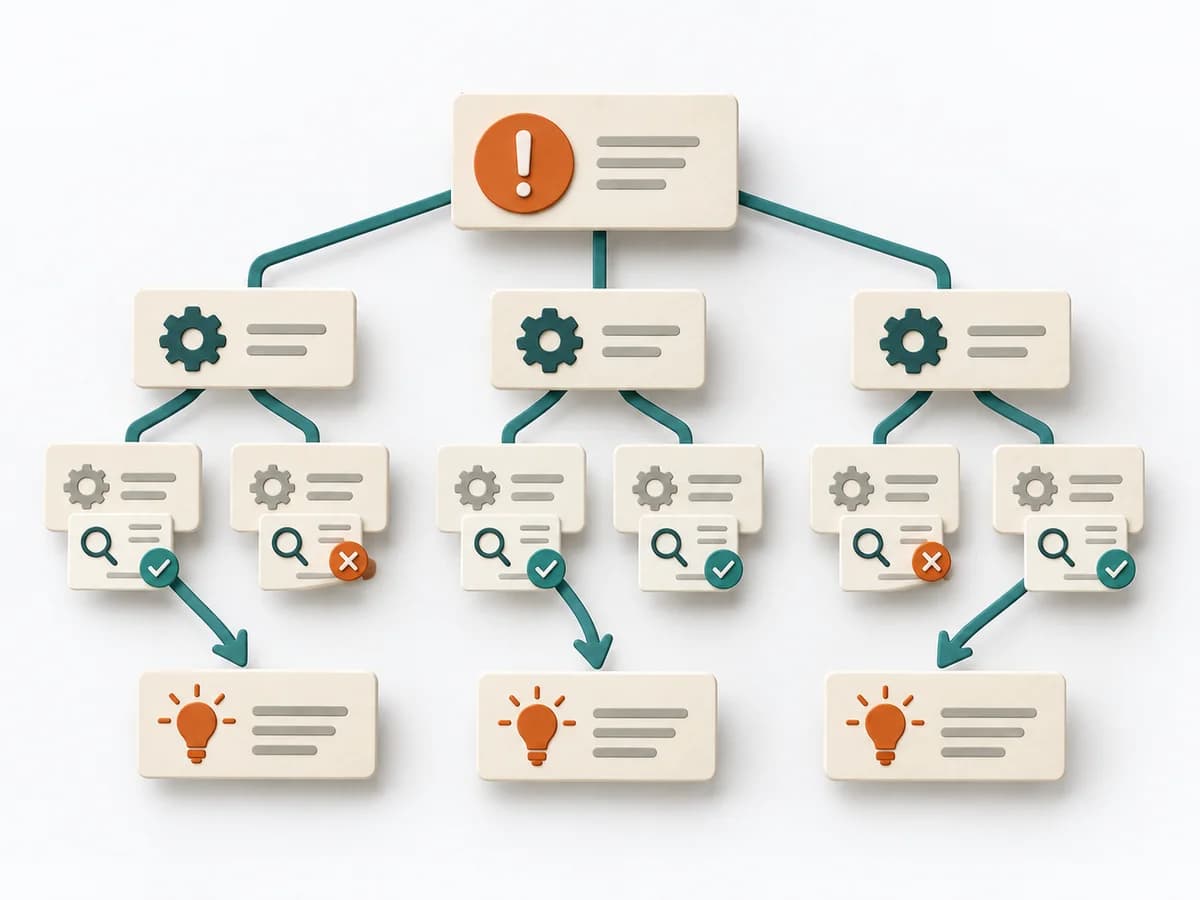 Operations Root Cause Tree Analysis |  Operations Fishbone Diagram | 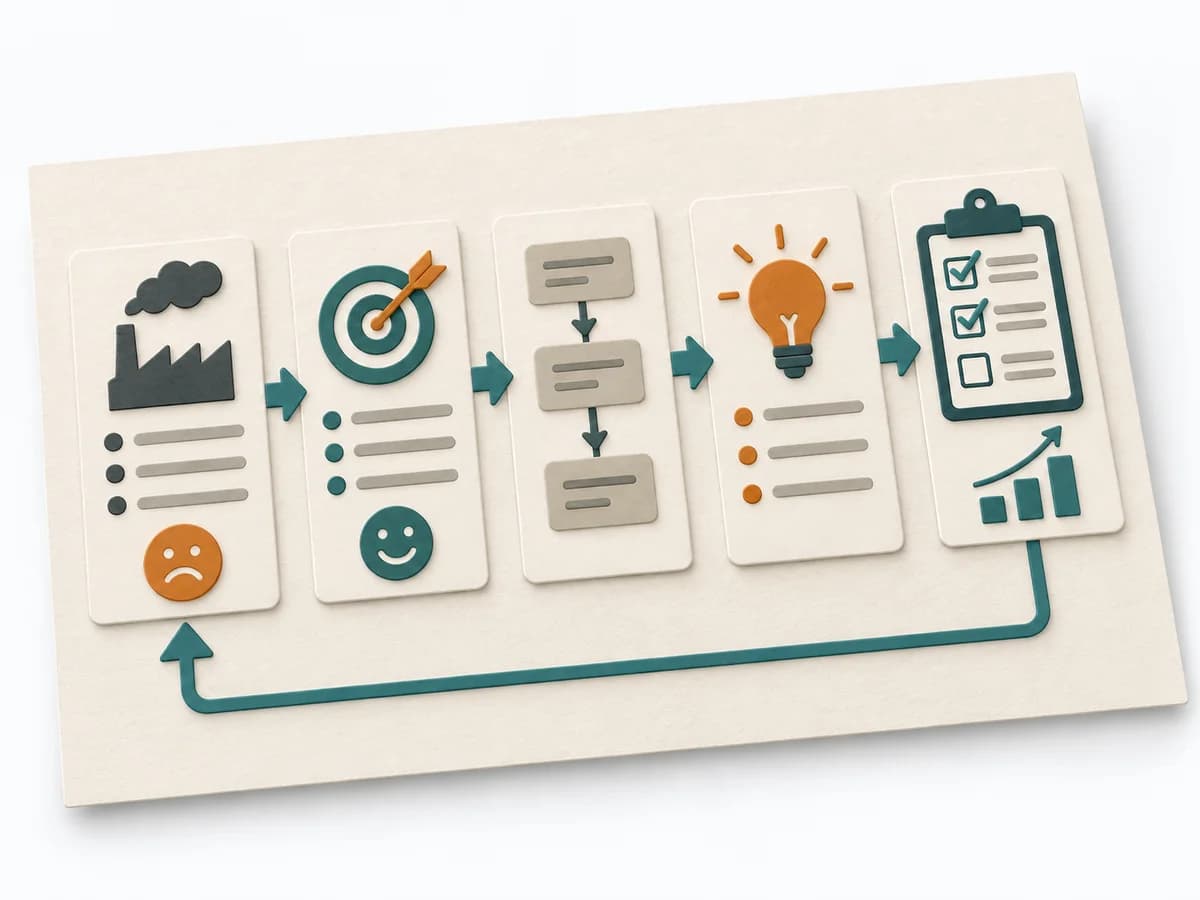 Operations A3 Problem Solving |
|---|---|---|---|
Purposedifferent | For a problem with several suspected causes, the method builds a causal structure instead of a mere list. It makes visible how causes connect and where the strongest points of leverage lie. | When a problem has several possible contributing factors, the method sorts causes by cause areas. It prevents an initial hunch from blocking the view of other plausible drivers. | For a complex deviation with several people involved, the method bundles problem, analysis, and decision onto one page. It creates a shared working space where causes, countermeasures, and follow-up fit together. |
Complexitydifferent | Medium | Low | Medium |
Timedifferent | 1-3 h | 30-60 min | 45-90 min |
Participantsdifferent | 2-8 | 2-8 | 2-5 |
Formatdifferent | Workshop | Workshop | Workshop + async |
Outputdifferent | Cause Tree, Evidence Notes, Countermeasures | Fishbone Diagram, Cause Categories, Investigation Backlog | A3 Report, Action Plan, Root Cause Analysis |
Tagsno overlap | Root causeTreeIncidentQuality | Root causeQualityOperations | LeanProblem solvingCoachingOperations |
Often compared together
Methods with strong topical overlap with the current selection, not yet in the comparison.



