View methods side by side.
Choose up to four methods. Add them using the search and share the comparison by copying its link.
| Criterion |  Product Strategy RICE Scoring | 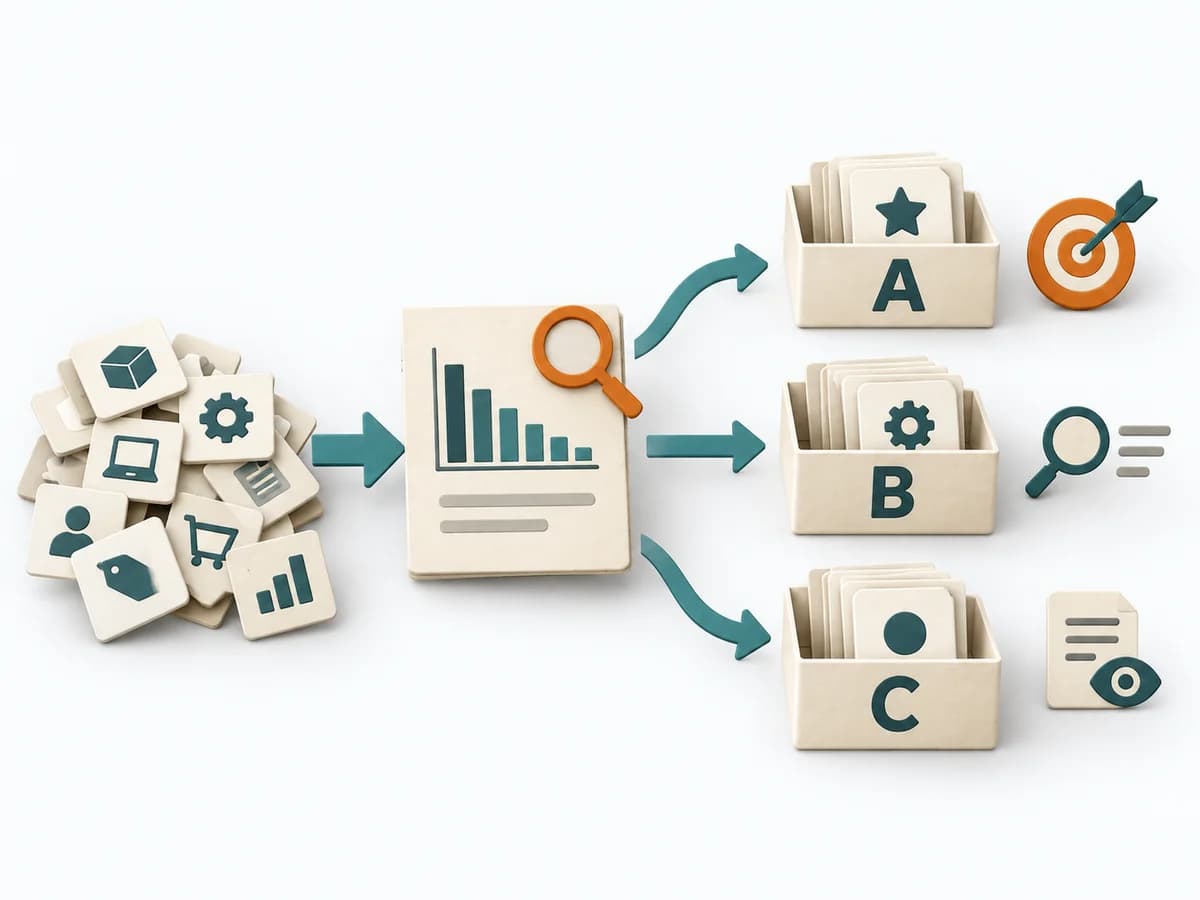 Operations ABC Analysis |  Operations Root Cause Analysis |
|---|---|---|---|
Purposedifferent | When many initiatives compete for the same resources, it brings reach, impact, confidence, and effort into one shared ranking. It makes prioritization economically connectable. | With many similar objects of differing economic significance, the method prioritizes effort by effect. It separates what needs regular steering from what rarely needs attention. | When a problem keeps recurring and the cause stays unclear, the method exposes the underlying mechanism. It separates symptom, guess, and robust explanation from one another. |
Complexitydifferent | Medium | Low | Medium |
Timedifferent | 60-90 min | 30-60 min | 1-4 h |
Participantsdifferent | 2-10 | 1-5 | 3-8 |
Formatdifferent | Workshop + async | Async | Workshop + async |
Outputdifferent | RICE Scores, Ranked List, Assumption Log | ABC Classification, Focus Rules, Control List | Problem Statement, Cause Hypotheses, Confirmed Causes, Action Plan |
Tagsno overlap | PrioritizationScoringRoadmapTradeoffs | PrioritizationOperationsPortfolio | Root causeProblem solvingQualityIncident |
Often compared together
Methods with strong topical overlap with the current selection, not yet in the comparison.



