View methods side by side.
Choose up to four methods. Add them using the search and share the comparison by copying its link.
| Criterion |  Product Strategy Product Canvas |  Operations 8D Problem Solving | 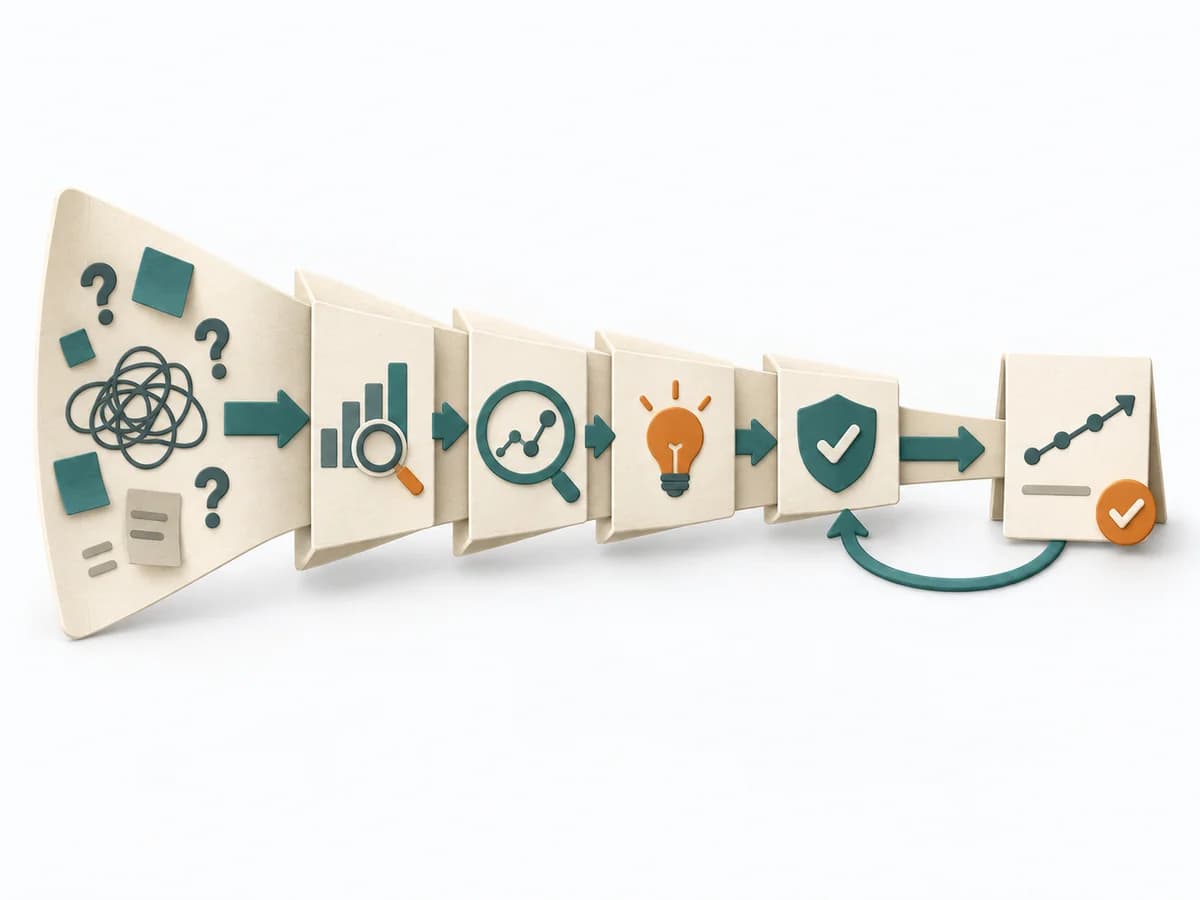 Operations DMAIC |
|---|---|---|---|
Purposedifferent | When product goal and feature scope don't yet fit cleanly together, it creates a shared working picture. It connects need, core features, and assumptions into a solid starting point. | For an acute quality or delivery problem, the method structures immediate protection and root cause work together. It keeps the situation stable while the actual cause is investigated cleanly. | For a process problem with fluctuating performance, the method brings analysis and improvement into a disciplined sequence. It creates a framework in which numbers, causes, and control come together. |
Complexitydifferent | Medium | High | High |
Timedifferent | 1-2 h | 1-6 Wochen | 2-12 Wochen |
Participantsdifferent | 2-8 | 4-10 | 3-10 |
Formatsame | Workshop + async | Workshop + async | Workshop + async |
Outputdifferent | Product Canvas, Product Assumptions, Scope Notes | 8D Report, Containment Plan, Root Cause Evidence, Corrective Action Plan | Project Charter, Measurement Plan, Cause Analysis, Control Plan |
Tagsno overlap | CanvasDiscoveryScope | QualityProblem solvingRoot cause | Continuous improvementQualityProcess improvement |
Often compared together
Methods with strong topical overlap with the current selection, not yet in the comparison.



