View methods side by side.
Choose up to four methods. Add them using the search and share the comparison by copying its link.
| Criterion | 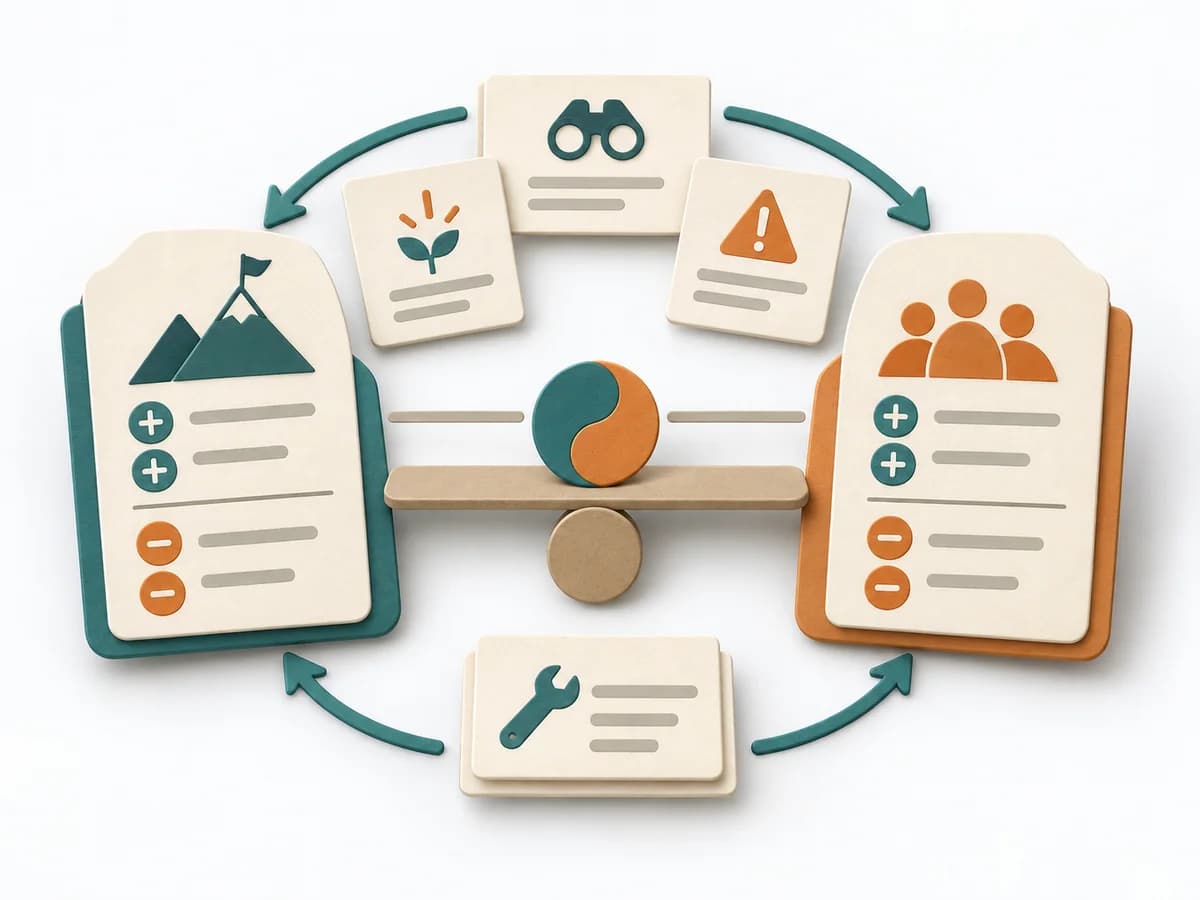 Systems Thinking Polarity Mapping |  Operations Fishbone Diagram |  Systems Thinking Current Reality Tree |
|---|---|---|---|
Purposedifferent | Polarity Mapping makes tensions between two opposing poles tangible, such as standardization and adaptation or control and autonomy. The method guards against making apparent either-or decisions prematurely. | When a problem has several possible contributing factors, the method sorts causes by cause areas. It prevents an initial hunch from blocking the view of other plausible drivers. | A Current Reality Tree condenses many symptoms into a few causal chains. The method makes visible which core problems drive several negative effects at once. |
Complexitydifferent | Medium | Low | High |
Timedifferent | 1-2 h | 30-60 min | 2-6 h |
Participantsdifferent | 3-12 | 2-8 | 3-8 |
Formatsame | Workshop | Workshop | Workshop |
Outputdifferent | Polarity Map, Warning Signs, Balance Actions | Fishbone Diagram, Cause Categories, Investigation Backlog | Current Reality Tree, Core Problems, Intervention Ideas |
Tagsno overlap | Systems thinkingTradeoffsLeadership | Root causeQualityOperations | Systems thinkingRoot causeConstraintsCausality |
Often compared together
Methods with strong topical overlap with the current selection, not yet in the comparison.