View methods side by side.
Choose up to four methods. Add them using the search and share the comparison by copying its link.
| Criterion | 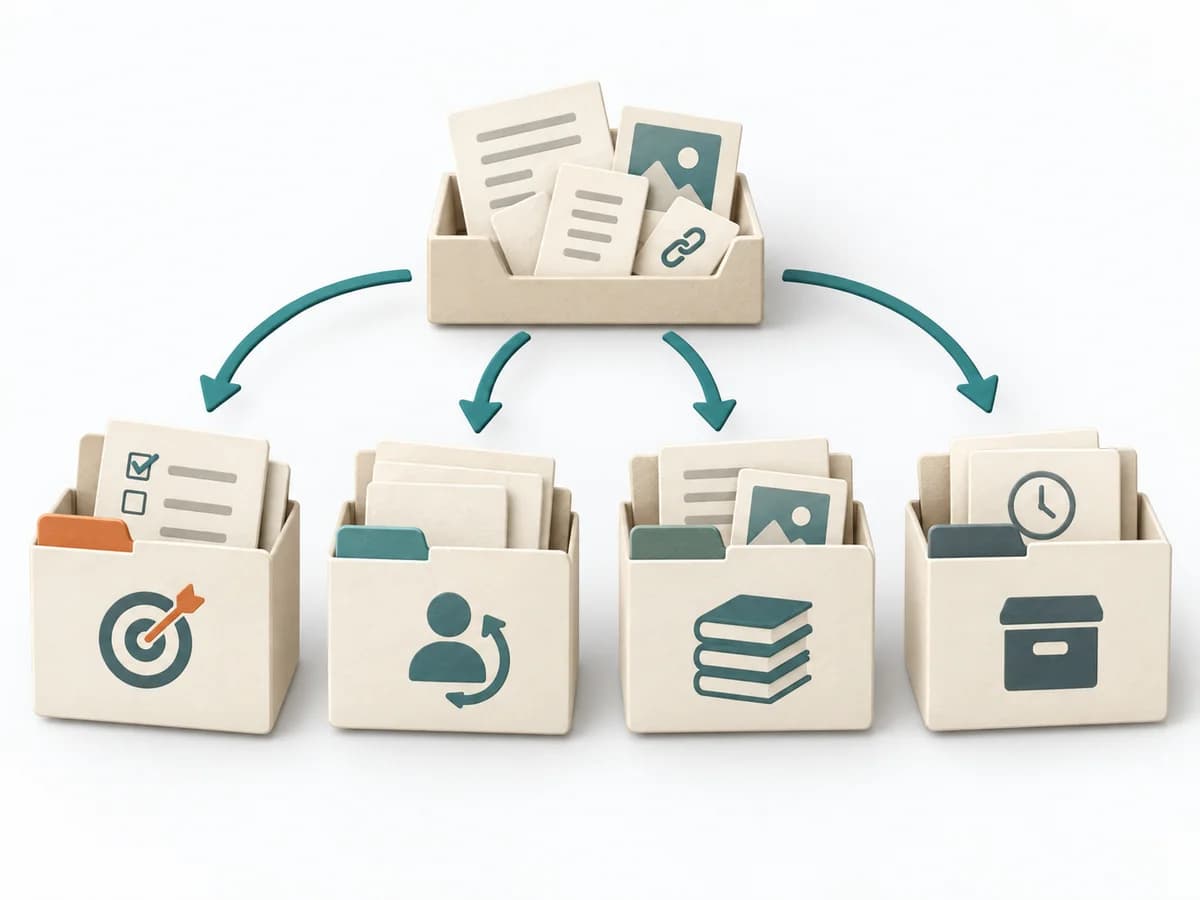 Knowledge Modeling PARA Method |  UX Design Customer Journey Canvas |  Operations Fishbone Diagram |
|---|---|---|---|
Purposedifferent | The PARA Method organizes knowledge into Projects, Areas, Resources, and Archives. It creates order when digital notes, files, and tasks no longer cleanly fit current work. | When a journey needs to be understood across several phases, it arranges experience, touchpoints, and opportunities into one picture. It makes gaps and friction along the user path clear. | When a problem has several possible contributing factors, the method sorts causes by cause areas. It prevents an initial hunch from blocking the view of other plausible drivers. |
Complexitydifferent | Medium | Medium | Low |
Timedifferent | 1-3 h Setup, laufend | 1-3 h | 30-60 min |
Participantsdifferent | 1 | 3-10 | 2-8 |
Formatdifferent | Async | Workshop | Workshop |
Outputdifferent | PARA Structure, Project Notes, Knowledge Archive | Customer Journey Canvas, Pain Points, Experience Opportunities | Fishbone Diagram, Cause Categories, Investigation Backlog |
Tagsno overlap | KnowledgeProductivityOrganization | JourneyCustomerService designCanvas | Root causeQualityOperations |
Often compared together
Methods with strong topical overlap with the current selection, not yet in the comparison.