View methods side by side.
Choose up to four methods. Add them using the search and share the comparison by copying its link.
| Criterion | 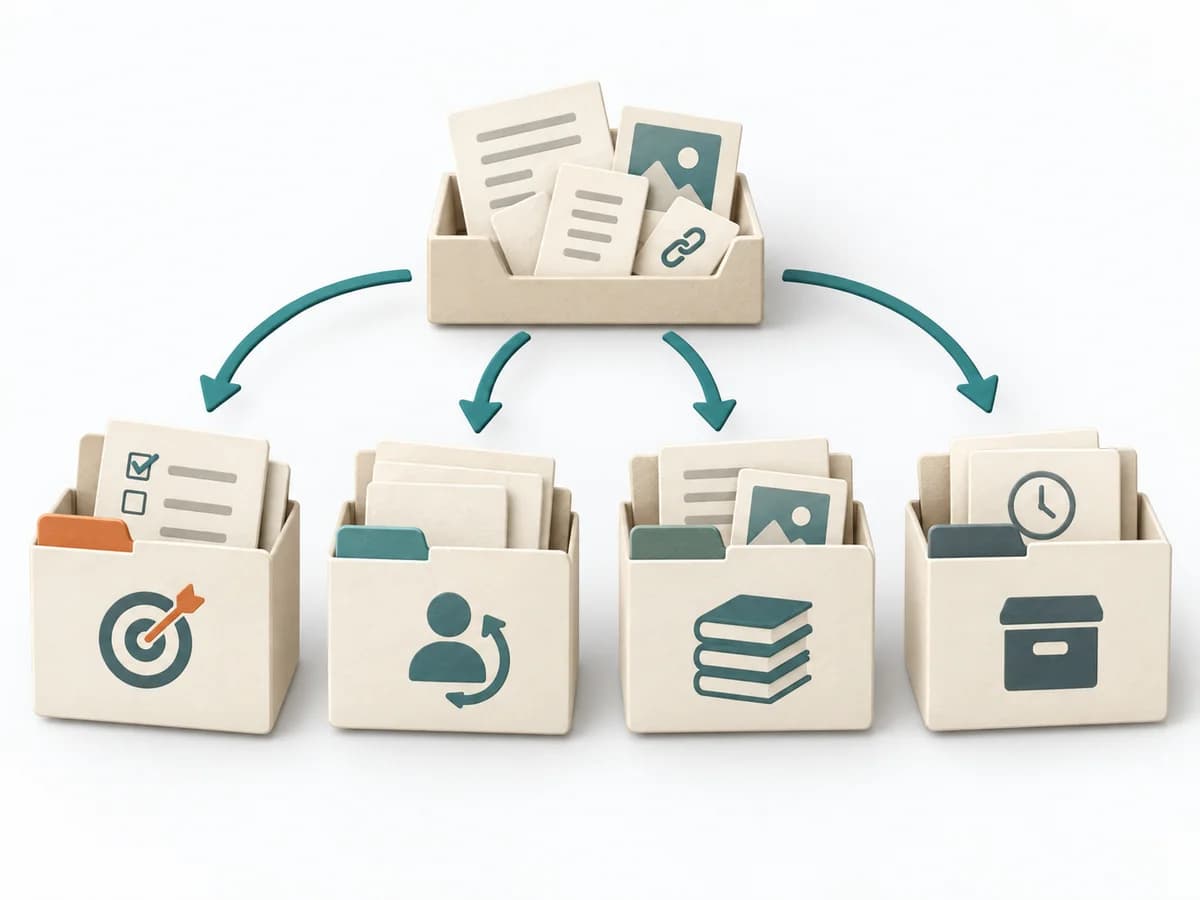 Knowledge Modeling PARA Method |  Operations Change Analysis |  Systems Thinking Causal Loop Diagram |
|---|---|---|---|
Purposedifferent | The PARA Method organizes knowledge into Projects, Areas, Resources, and Archives. It creates order when digital notes, files, and tasks no longer cleanly fit current work. | For a deviation after a change, the method isolates the influence of the altered condition. It narrows down which differences are relevant and which are just accompanying noise. | A Causal Loop Diagram makes feedback, reinforcement, and balance in a system legible. It uncovers side effects and self-reinforcement that stay hidden in linear explanations. |
Complexitysame | Medium | Medium | Medium |
Timedifferent | 1-3 h Setup, laufend | 45-120 min | 1-3 h |
Participantsdifferent | 1 | 2-6 | 2-8 |
Formatdifferent | Async | Workshop + async | Workshop |
Outputdifferent | PARA Structure, Project Notes, Knowledge Archive | Change Matrix, Cause Hypotheses, Validation Questions, Action List | Causal Loop Diagram, Feedback Notes, Leverage Points |
Tagsno overlap | KnowledgeProductivityOrganization | ChangeRoot causeTroubleshootingComparison | FeedbackSystems thinkingCausalityDynamics |
Often compared together
Methods with strong topical overlap with the current selection, not yet in the comparison.



